
 Yahoo Finance
 Will Weakness in Towable Unit Dent Winnebago (WGO) Q1 Earnings?
Winnebago Industries WGO is scheduled to release first-quarter fiscal 2023 results on Dec 16, before the opening bell. The Zacks Consensus Estimate for the to-be-reported quarter’s earnings per share and revenues is pegged at $1.83 and $898.6 million, respectively.
The Zacks Consensus Estimate for Winnebago’s fiscal first-quarter earnings per share has been revised downward by 12 cents in the past 30 days. The bottom-line projection implies a year-over-year decline of 48%. The Zacks Consensus Estimate for revenues also suggests a year-over-year contraction of 22.25%.
One of the leading recreational vehicle (RV) manufacturers in the world, Winnebago posted better-than-expected earnings in the last reported quarter on higher-than-anticipated revenues and pre-tax income from the Motorhome and Marine segments. The company surpassed the Zacks Consensus Estimate in the trailing four quarters, with the average being 25.53%. Investors are expecting WGO to pull off an earnings beat this time as well. Discouragingly, our model doesn’t predict the same.
Winnebago Industries, Inc. Price and EPS Surprise
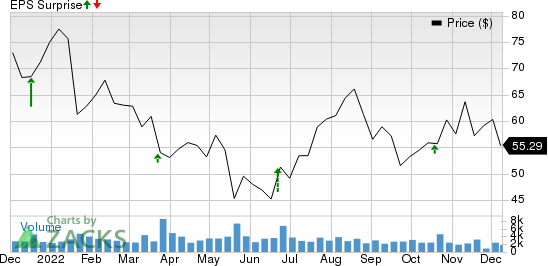
Winnebago Industries, Inc. price-eps-surprise | Winnebago Industries, Inc. Quote
Factors to Shape Q1 Results
The RV market is highly consumer cyclic and dependent on business cycles and economic conditions. Fears of economic slowdown triggered by high inflation and rising interest rates have started to weigh on industry participants like Winnebago. The number of RV units sold by Winnebago in the fiscal first quarter of 2023 is likely to have declined from the year-ago period.
In addition to the declining unit sales, inflationary concerns and severe supply chain disruptions have been increasing the cost of manufacturing RVs. What’s partially offsetting these headwinds is the smart pricing actions undertaken by the company to pass the rising costs of raw materials and other components to customers.
Let’s look at the key fiscal first-quarter 2023 projections for the company’s segments.
The Zacks Consensus Estimate for fiscal first-quarter revenues from the Towable segment is pegged at $427 million, indicating a decline from $651 million recorded in the year-ago quarter. The consensus mark for units sold in this segment is 9,378 units, implying a sharp decline from 16,431 units reported in the prior-year quarter. The estimate for adjusted EBITDA is pegged at $57 million, suggesting a decline from $112 million in the corresponding quarter of fiscal 2022.
The consensus mark for revenues from the Motorhome segment is $481 million, indicating an increase from $421 million recorded in the previous-year quarter. The estimate for units sold is 2,973, suggesting a rise from 2,735 reported in the year-ago period. The adjusted EBITDA estimate of the segment is $56 million, implying an uptick from $50 million recorded in first-quarter fiscal 2022.
The consensus mark for revenues from the Marine segment is $106 million, implying a rise from $79 million recorded in the year-ago quarter. The estimate for units sold is 1,423, suggesting an increase from 1,135 reported in the year-ago period. The adjusted EBITDA estimate for the segment is $15.26 million, implying growth from $10.57 million generated in the fiscal first quarter of 2022.
What Does Our Model Say
Our proven model doesn’t conclusively predict an earnings beat for Winnebago in the to-be-reported quarter, as it does not have the right combination of the two key ingredients. The combination of a positive Earnings ESP and a Zacks Rank #1 (Strong Buy), 2 (Buy) or 3 (Hold) increases the odds of an earnings beat. That’s not the case here.
Earnings ESP: WGO has an Earnings ESP of +6.56%. This is because the Most Accurate Estimate is pegged 12 cents higher the Zacks Consensus Estimate. You can uncover the best stocks to buy or sell before they’re reported with our Earnings ESP Filter.
Zacks Rank: Winnebago carries a Zacks Rank of 5 (Strong Sell) currently.
You can see the complete list of today’s Zacks #1 Rank stocks here.
What Did Thor’s Latest Quarterly Report Unveil?
Thor Industries THO delivered mixed results for first-quarter fiscal 2023 (ended Oct 31, 2022). Adjusted earnings of $2.53 per share surpassed the Zacks Consensus Estimate of $2.09. This marked the 11th straight earnings beat for Thor. The bottom line, however, declined from the year-ago profit of $4.34 per share. The company registered revenues of $3,108.1 million for the quarter under review, missing the Zacks Consensus Estimate of $3,117 million. The top line also fell 21.5% year over year.
Thor expects fiscal 2023 net sales in the band of $11.5-$12.5 billion, implying a decline from $16.31 billion recorded in fiscal 2022. The gross profit margin is expected in the range of 14.2-14.9%. Earnings per share are envisioned to be between $7.40 and $8.70, suggesting a sharp contraction from $20.59 in fiscal 2022.
Want the latest recommendations from Zacks Investment Research? Today, you can download 7 Best Stocks for the Next 30 Days. Click to get this free report
Thor Industries, Inc. (THO) : Free Stock Analysis Report
Winnebago Industries, Inc. (WGO) : Free Stock Analysis Report
