
 Yahoo Finance
 Is Weakness In EBOS Group Limited (NZSE:EBO) Stock A Sign That The Market Could be Wrong Given Its Strong Financial Prospects?
EBOS Group (NZSE:EBO) has had a rough week with its share price down 6.3%. But if you pay close attention, you might gather that its strong financials could mean that the stock could potentially see an increase in value in the long-term, given how markets usually reward companies with good financial health. In this article, we decided to focus on EBOS Group's ROE.
Return on equity or ROE is a key measure used to assess how efficiently a company's management is utilizing the company's capital. In simpler terms, it measures the profitability of a company in relation to shareholder's equity.
Check out our latest analysis for EBOS Group
How To Calculate Return On Equity?
The formula for ROE is:
Return on Equity = Net Profit (from continuing operations) ÷ Shareholders' Equity
So, based on the above formula, the ROE for EBOS Group is:
13% = AU$184m ÷ AU$1.4b (Based on the trailing twelve months to June 2021).
The 'return' is the profit over the last twelve months. One way to conceptualize this is that for each NZ$1 of shareholders' capital it has, the company made NZ$0.13 in profit.
What Has ROE Got To Do With Earnings Growth?
We have already established that ROE serves as an efficient profit-generating gauge for a company's future earnings. Depending on how much of these profits the company reinvests or "retains", and how effectively it does so, we are then able to assess a company’s earnings growth potential. Generally speaking, other things being equal, firms with a high return on equity and profit retention, have a higher growth rate than firms that don’t share these attributes.
EBOS Group's Earnings Growth And 13% ROE
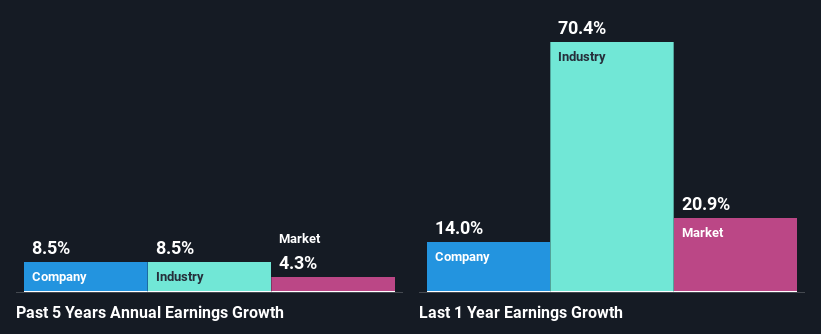
To begin with, EBOS Group seems to have a respectable ROE. Further, the company's ROE is similar to the industry average of 16%. Consequently, this likely laid the ground for the decent growth of 8.5% seen over the past five years by EBOS Group.
We then performed a comparison between EBOS Group's net income growth with the industry, which revealed that the company's growth is similar to the average industry growth of 8.5% in the same period.
Earnings growth is an important metric to consider when valuing a stock. It’s important for an investor to know whether the market has priced in the company's expected earnings growth (or decline). This then helps them determine if the stock is placed for a bright or bleak future. Has the market priced in the future outlook for EBO? You can find out in our latest intrinsic value infographic research report.
Is EBOS Group Using Its Retained Earnings Effectively?
The high three-year median payout ratio of 73% (or a retention ratio of 27%) for EBOS Group suggests that the company's growth wasn't really hampered despite it returning most of its income to its shareholders.
Besides, EBOS Group has been paying dividends for at least ten years or more. This shows that the company is committed to sharing profits with its shareholders. Upon studying the latest analysts' consensus data, we found that the company is expected to keep paying out approximately 72% of its profits over the next three years. Still, forecasts suggest that EBOS Group's future ROE will rise to 16% even though the the company's payout ratio is not expected to change by much.
Conclusion
In total, we are pretty happy with EBOS Group's performance. Especially the high ROE, Which has contributed to the impressive growth seen in earnings. Despite the company reinvesting only a small portion of its profits, it still has managed to grow its earnings so that is appreciable. With that said, the latest industry analyst forecasts reveal that the company's earnings are expected to accelerate. To know more about the latest analysts predictions for the company, check out this visualization of analyst forecasts for the company.
Have feedback on this article? Concerned about the content? Get in touch with us directly. Alternatively, email editorial-team (at) simplywallst.com.
This article by Simply Wall St is general in nature. We provide commentary based on historical data and analyst forecasts only using an unbiased methodology and our articles are not intended to be financial advice. It does not constitute a recommendation to buy or sell any stock, and does not take account of your objectives, or your financial situation. We aim to bring you long-term focused analysis driven by fundamental data. Note that our analysis may not factor in the latest price-sensitive company announcements or qualitative material. Simply Wall St has no position in any stocks mentioned.
