
 Yahoo Finance
 Wayfair (W) Q1 Loss Narrower Than Expected, Revenues Fall Y/Y
Wayfair W reported a first-quarter 2024 non-GAAP loss of 32 cents per share, narrower than the Zacks Consensus Estimate for a loss of 45 cents per share. The company reported a loss of $1.13 per share in the year-ago quarter.
Net revenues of $2.73 billion surpassed the consensus mark by 3.3%. The top line decreased 1.6% year over year.
LTM net revenues per active customer decreased 2.8% year over year to $537, which beat the Zacks Consensus Estimate by 0.45%.
Nevertheless, growth in the active customer base remained a positive. Active customers were up 2.8% year over year to 22.3 million and beat the consensus mark by 0.26%.
Wayfair Inc. Price, Consensus and EPS Surprise
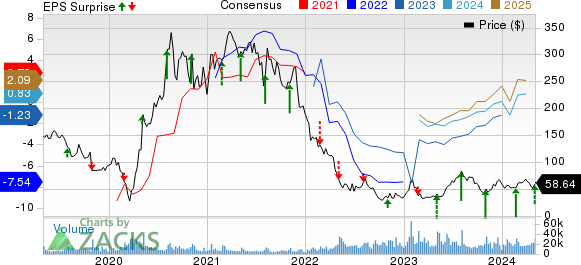
Wayfair Inc. price-consensus-eps-surprise-chart | Wayfair Inc. Quote
Quarter Details
Net revenues in the United States (87.6% of total net revenues) decreased 1% year over year to $2.4 billion. The figure beat the Zacks Consensus Estimate by 4.1%.
International net revenues (12.4% of total net revenues) declined 5.8% year over year and 7.5% on a constant currency basis to $338 million. It missed the consensus mark by 0.7%.
Orders per customer for the quarter were 1.84, up from 1.81 reported in the year-ago quarter. The figure beat the Zacks Consensus Estimate by 3.5%.
The average order value declined 0.7% year over year to $285, which beat the consensus mark by 4.99%.
The total number of orders delivered in the reported quarter was 9.6 million, which decreased 1% year over year.
Repeat customers placed 7.7 million orders (accounting for 80.5% of total orders) in the first quarter, up 1.3% year over year.
Additionally, 63.1% of total orders delivered were placed through mobile devices in the reported quarter compared with 62.1% in the year-ago quarter.
Operating Results
Wayfair’s first-quarter gross margin was 30%, expanding 40 basis points on a year-over-year basis.
Adjusted EBITDA was $75 million against an EBITDA loss of $14 million in the year-ago quarter.
Customer service and merchant fees decreased 15.8% year over year to $117 million.
Advertising expenses fell 0.9% year over year to $324 million. Selling, operations, technology and general and administrative expenses decreased 14.4% year over year to $534 million.
Wayfair incurred a GAAP operating loss of $235 million in the reported quarter compared with an operating loss of $347 million in the year-ago quarter.
Balance Sheet & Cash Flow
As of Mar 31, 2024, cash, cash equivalents and short-term investments were $1.2 billion, down from $1.4 billion reported on Dec 31, 2023.
Long-term debt, as of Mar 31, 2024, was $3.095 billion compared with $3.092 billion on Dec 31, 2023.
In the first quarter, cash used in operations amounted to $139 million compared with $158 million generated from operations in the fourth quarter.
Wayfair reported a free cash outflow of $193 million in the first quarter.
Zacks Rank & Other Stocks to Consider
Currently, Wayfair has a Zacks Rank #2 (Buy).
Some other top-ranked stocks in the retail-wholesale sector are The Gap GPS, DICK'S Sporting Goods DKS and Target TGT, each carrying a Zacks Rank #2 at present. You can see the complete list of today’s Zacks #1 Rank stocks here.
The Gap has lost 3.6% in the year-to-date period. The long-term earnings growth rate for GPS is currently estimated at 12%.
DICK'S Sporting Goods shares have gained 41.2% in the year-to-date period. DKS’ long-term earnings growth rate is currently projected at 35.5%.
Target has gained 12.8% in the year-to-date period. The long-term earnings growth rate for TGT is currently anticipated at 11.36%.
Want the latest recommendations from Zacks Investment Research? Today, you can download 7 Best Stocks for the Next 30 Days. Click to get this free report
Target Corporation (TGT) : Free Stock Analysis Report
The Gap, Inc. (GPS) : Free Stock Analysis Report
DICK'S Sporting Goods, Inc. (DKS) : Free Stock Analysis Report
Wayfair Inc. (W) : Free Stock Analysis Report
