
 Yahoo Finance
 Be Wary Of Pop Culture Group (NASDAQ:CPOP) And Its Returns On Capital
Did you know there are some financial metrics that can provide clues of a potential multi-bagger? In a perfect world, we'd like to see a company investing more capital into its business and ideally the returns earned from that capital are also increasing. Put simply, these types of businesses are compounding machines, meaning they are continually reinvesting their earnings at ever-higher rates of return. Although, when we looked at Pop Culture Group (NASDAQ:CPOP), it didn't seem to tick all of these boxes.
Return On Capital Employed (ROCE): What is it?
Just to clarify if you're unsure, ROCE is a metric for evaluating how much pre-tax income (in percentage terms) a company earns on the capital invested in its business. To calculate this metric for Pop Culture Group, this is the formula:
Return on Capital Employed = Earnings Before Interest and Tax (EBIT) ÷ (Total Assets - Current Liabilities)
0.069 = US$3.8m ÷ (US$66m - US$11m) (Based on the trailing twelve months to December 2021).
Thus, Pop Culture Group has an ROCE of 6.9%. On its own that's a low return on capital but it's in line with the industry's average returns of 6.9%.
Check out our latest analysis for Pop Culture Group
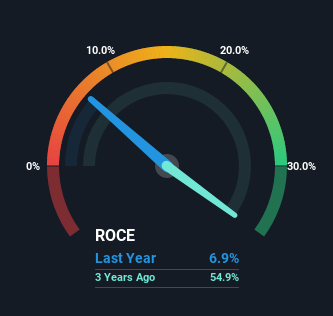
Historical performance is a great place to start when researching a stock so above you can see the gauge for Pop Culture Group's ROCE against it's prior returns. If you want to delve into the historical earnings, revenue and cash flow of Pop Culture Group, check out these free graphs here.
What The Trend Of ROCE Can Tell Us
In terms of Pop Culture Group's historical ROCE movements, the trend isn't fantastic. Around five years ago the returns on capital were 35%, but since then they've fallen to 6.9%. However, given capital employed and revenue have both increased it appears that the business is currently pursuing growth, at the consequence of short term returns. And if the increased capital generates additional returns, the business, and thus shareholders, will benefit in the long run.
On a related note, Pop Culture Group has decreased its current liabilities to 16% of total assets. That could partly explain why the ROCE has dropped. Effectively this means their suppliers or short-term creditors are funding less of the business, which reduces some elements of risk. Since the business is basically funding more of its operations with it's own money, you could argue this has made the business less efficient at generating ROCE.
The Key Takeaway
Even though returns on capital have fallen in the short term, we find it promising that revenue and capital employed have both increased for Pop Culture Group. Despite these promising trends, the stock has collapsed 95% over the last year, so there could be other factors hurting the company's prospects. Therefore, we'd suggest researching the stock further to uncover more about the business.
One final note, you should learn about the 4 warning signs we've spotted with Pop Culture Group (including 1 which is potentially serious) .
For those who like to invest in solid companies, check out this free list of companies with solid balance sheets and high returns on equity.
Have feedback on this article? Concerned about the content? Get in touch with us directly. Alternatively, email editorial-team (at) simplywallst.com.
This article by Simply Wall St is general in nature. We provide commentary based on historical data and analyst forecasts only using an unbiased methodology and our articles are not intended to be financial advice. It does not constitute a recommendation to buy or sell any stock, and does not take account of your objectives, or your financial situation. We aim to bring you long-term focused analysis driven by fundamental data. Note that our analysis may not factor in the latest price-sensitive company announcements or qualitative material. Simply Wall St has no position in any stocks mentioned.
