
 Yahoo Finance
 Be Wary Of Express (NYSE:EXPR) And Its Returns On Capital
If we're looking to avoid a business that is in decline, what are the trends that can warn us ahead of time? Businesses in decline often have two underlying trends, firstly, a declining return on capital employed (ROCE) and a declining base of capital employed. Basically the company is earning less on its investments and it is also reducing its total assets. Having said that, after a brief look, Express (NYSE:EXPR) we aren't filled with optimism, but let's investigate further.
What Is Return On Capital Employed (ROCE)?
For those that aren't sure what ROCE is, it measures the amount of pre-tax profits a company can generate from the capital employed in its business. To calculate this metric for Express, this is the formula:
Return on Capital Employed = Earnings Before Interest and Tax (EBIT) ÷ (Total Assets - Current Liabilities)
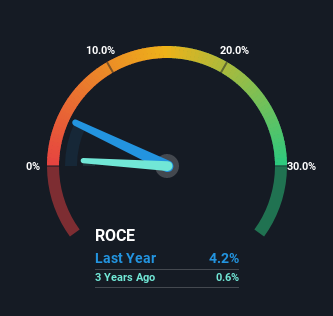
0.042 = US$28m ÷ (US$1.2b - US$499m) (Based on the trailing twelve months to July 2022).
So, Express has an ROCE of 4.2%. Ultimately, that's a low return and it under-performs the Specialty Retail industry average of 18%.
View our latest analysis for Express
In the above chart we have measured Express' prior ROCE against its prior performance, but the future is arguably more important. If you're interested, you can view the analysts predictions in our free report on analyst forecasts for the company.
What Does the ROCE Trend For Express Tell Us?
We are a bit anxious about the trends of ROCE at Express. The company used to generate 6.8% on its capital five years ago but it has since fallen noticeably. In addition to that, Express is now employing 23% less capital than it was five years ago. When you see both ROCE and capital employed diminishing, it can often be a sign of a mature and shrinking business that might be in structural decline. If these underlying trends continue, we wouldn't be too optimistic going forward.
While on the subject, we noticed that the ratio of current liabilities to total assets has risen to 43%, which has impacted the ROCE. If current liabilities hadn't increased as much as they did, the ROCE could actually be even lower. What this means is that in reality, a rather large portion of the business is being funded by the likes of the company's suppliers or short-term creditors, which can bring some risks of its own.
The Key Takeaway
In summary, it's unfortunate that Express is shrinking its capital base and also generating lower returns. Unsurprisingly then, the stock has dived 80% over the last five years, so investors are recognizing these changes and don't like the company's prospects. Unless there is a shift to a more positive trajectory in these metrics, we would look elsewhere.
Since virtually every company faces some risks, it's worth knowing what they are, and we've spotted 4 warning signs for Express (of which 2 are significant!) that you should know about.
While Express isn't earning the highest return, check out this free list of companies that are earning high returns on equity with solid balance sheets.
Have feedback on this article? Concerned about the content? Get in touch with us directly. Alternatively, email editorial-team (at) simplywallst.com.
This article by Simply Wall St is general in nature. We provide commentary based on historical data and analyst forecasts only using an unbiased methodology and our articles are not intended to be financial advice. It does not constitute a recommendation to buy or sell any stock, and does not take account of your objectives, or your financial situation. We aim to bring you long-term focused analysis driven by fundamental data. Note that our analysis may not factor in the latest price-sensitive company announcements or qualitative material. Simply Wall St has no position in any stocks mentioned.
Join A Paid User Research Session
You’ll receive a US$30 Amazon Gift card for 1 hour of your time while helping us build better investing tools for the individual investors like yourself. Sign up here
