
 Yahoo Finance
 Wagners Holding (ASX:WGN) investors are sitting on a loss of 77% if they invested five years ago
Some stocks are best avoided. It hits us in the gut when we see fellow investors suffer a loss. Anyone who held Wagners Holding Company Limited (ASX:WGN) for five years would be nursing their metaphorical wounds since the share price dropped 78% in that time. And we doubt long term believers are the only worried holders, since the stock price has declined 52% over the last twelve months. The falls have accelerated recently, with the share price down 13% in the last three months.
It's worthwhile assessing if the company's economics have been moving in lockstep with these underwhelming shareholder returns, or if there is some disparity between the two. So let's do just that.
See our latest analysis for Wagners Holding
There is no denying that markets are sometimes efficient, but prices do not always reflect underlying business performance. One flawed but reasonable way to assess how sentiment around a company has changed is to compare the earnings per share (EPS) with the share price.
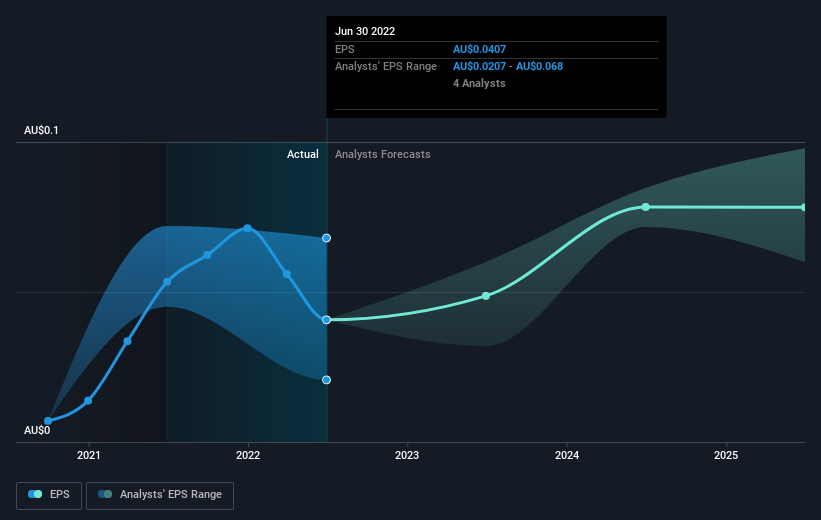
Looking back five years, both Wagners Holding's share price and EPS declined; the latter at a rate of 23% per year. Notably, the share price has fallen at 26% per year, fairly close to the change in the EPS. This suggests that market participants have not changed their view of the company all that much. Rather, the share price has approximately tracked EPS growth.
The company's earnings per share (over time) is depicted in the image below (click to see the exact numbers).
We consider it positive that insiders have made significant purchases in the last year. Having said that, most people consider earnings and revenue growth trends to be a more meaningful guide to the business. Dive deeper into the earnings by checking this interactive graph of Wagners Holding's earnings, revenue and cash flow.
A Different Perspective
Investors in Wagners Holding had a tough year, with a total loss of 52%, against a market gain of about 3.8%. Even the share prices of good stocks drop sometimes, but we want to see improvements in the fundamental metrics of a business, before getting too interested. Unfortunately, last year's performance may indicate unresolved challenges, given that it was worse than the annualised loss of 12% over the last half decade. We realise that Baron Rothschild has said investors should "buy when there is blood on the streets", but we caution that investors should first be sure they are buying a high quality business. It's always interesting to track share price performance over the longer term. But to understand Wagners Holding better, we need to consider many other factors. For example, we've discovered 2 warning signs for Wagners Holding (1 is a bit unpleasant!) that you should be aware of before investing here.
If you like to buy stocks alongside management, then you might just love this free list of companies. (Hint: insiders have been buying them).
Please note, the market returns quoted in this article reflect the market weighted average returns of stocks that currently trade on AU exchanges.
Have feedback on this article? Concerned about the content? Get in touch with us directly. Alternatively, email editorial-team (at) simplywallst.com.
This article by Simply Wall St is general in nature. We provide commentary based on historical data and analyst forecasts only using an unbiased methodology and our articles are not intended to be financial advice. It does not constitute a recommendation to buy or sell any stock, and does not take account of your objectives, or your financial situation. We aim to bring you long-term focused analysis driven by fundamental data. Note that our analysis may not factor in the latest price-sensitive company announcements or qualitative material. Simply Wall St has no position in any stocks mentioned.
Join A Paid User Research Session
You’ll receive a US$30 Amazon Gift card for 1 hour of your time while helping us build better investing tools for the individual investors like yourself. Sign up here
