
 Yahoo Finance
 Vp's (LON:VP.) Returns On Capital Not Reflecting Well On The Business
To find a multi-bagger stock, what are the underlying trends we should look for in a business? Typically, we'll want to notice a trend of growing return on capital employed (ROCE) and alongside that, an expanding base of capital employed. Basically this means that a company has profitable initiatives that it can continue to reinvest in, which is a trait of a compounding machine. Having said that, from a first glance at Vp (LON:VP.) we aren't jumping out of our chairs at how returns are trending, but let's have a deeper look.
Return On Capital Employed (ROCE): What is it?
For those that aren't sure what ROCE is, it measures the amount of pre-tax profits a company can generate from the capital employed in its business. The formula for this calculation on Vp is:
Return on Capital Employed = Earnings Before Interest and Tax (EBIT) ÷ (Total Assets - Current Liabilities)
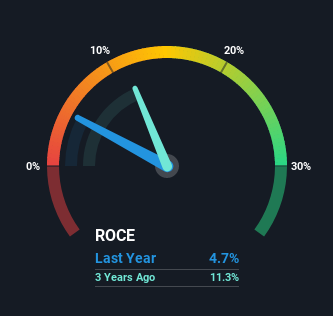
0.047 = UK£13m ÷ (UK£444m - UK£174m) (Based on the trailing twelve months to March 2021).
Thus, Vp has an ROCE of 4.7%. Ultimately, that's a low return and it under-performs the Trade Distributors industry average of 14%.
View our latest analysis for Vp
In the above chart we have measured Vp's prior ROCE against its prior performance, but the future is arguably more important. If you'd like, you can check out the forecasts from the analysts covering Vp here for free.
What Does the ROCE Trend For Vp Tell Us?
In terms of Vp's historical ROCE movements, the trend isn't fantastic. Around five years ago the returns on capital were 14%, but since then they've fallen to 4.7%. And considering revenue has dropped while employing more capital, we'd be cautious. If this were to continue, you might be looking at a company that is trying to reinvest for growth but is actually losing market share since sales haven't increased.
While on the subject, we noticed that the ratio of current liabilities to total assets has risen to 39%, which has impacted the ROCE. Without this increase, it's likely that ROCE would be even lower than 4.7%. Keep an eye on this ratio, because the business could encounter some new risks if this metric gets too high.
In Conclusion...
From the above analysis, we find it rather worrisome that returns on capital and sales for Vp have fallen, meanwhile the business is employing more capital than it was five years ago. Yet despite these concerning fundamentals, the stock has performed strongly with a 68% return over the last five years, so investors appear very optimistic. In any case, the current underlying trends don't bode well for long term performance so unless they reverse, we'd start looking elsewhere.
Vp does have some risks, we noticed 3 warning signs (and 2 which shouldn't be ignored) we think you should know about.
While Vp may not currently earn the highest returns, we've compiled a list of companies that currently earn more than 25% return on equity. Check out this free list here.
This article by Simply Wall St is general in nature. We provide commentary based on historical data and analyst forecasts only using an unbiased methodology and our articles are not intended to be financial advice. It does not constitute a recommendation to buy or sell any stock, and does not take account of your objectives, or your financial situation. We aim to bring you long-term focused analysis driven by fundamental data. Note that our analysis may not factor in the latest price-sensitive company announcements or qualitative material. Simply Wall St has no position in any stocks mentioned.
Have feedback on this article? Concerned about the content? Get in touch with us directly. Alternatively, email editorial-team (at) simplywallst.com.
