Vornado's (VNO) FFO Misses Estimates in Q1, Revenues Beat
Vornado Realty Trust’s VNO first-quarter 2023 funds from operations (FFO) plus assumed conversions as adjusted per share of 60 cents missed the Zacks Consensus Estimate of 62 cents. Moreover, the figure declined 24.1% year over year.
Quarterly results display better-than-anticipated revenues aided by healthy leasing activity. However, higher operating expenses acted as a dampener.
Total revenues came in at $445.9 million in the reported quarter, surpassing the Zacks Consensus Estimate of $443.7 million. On a year-over-year basis, revenues improved nearly 1%.
Quarter in Detail
In the reported quarter, total same-store net operating income (NOI) (at share) came in at $264.6 million compared with the prior-year quarter’s $264.7 million. The metric for the New York and 555 California Street portfolios improved 1.6% and 4.3%, respectively. However, the same-store NOI (at share) for THE MART portfolio declined 22.6% from the prior-year period.
Operating expenses flared up 5.7% to $228.8 million year over year.
During the quarter, in the New York office portfolio, 777,000 square feet of office space (771,000 square feet at share) was leased for an initial rent of $101.02 per square foot and a weighted average lease term of 9.5 years. The tenant improvements and leasing commissions were $2.48 per square foot per annum or 2.5% of the initial rent.
In the New York retail portfolio, 25,000 square feet were leased (20,000 square feet at share) at an initial rent of $373.07 per square foot and a weighted average lease term of 6.8 years. The tenant improvements and leasing commissions were $26.54 per square foot per annum or 7.1% of the initial rent.
Additionally, at THE MART, 79,000 square feet of space (all at share) was leased for an initial rent of $56.44 per square foot and a weighted average lease term of 6.8 years. The tenant improvements and leasing commissions were $8.04 per square foot per annum or 14.2% of the initial rent.
For VNO’s 555 California Street portfolio, 4,000 square feet of space (3,000 square feet at share) was leased for an initial rent of $156.96 per square foot and a weighted average lease term of seven years. The tenant improvements and leasing commissions were $39.07 per square foot per annum, or 24.9% of the initial rent.
Vornado ended the quarter with occupancy in the New York portfolio at 89.9%, down 130 basis points (bps) year over year. Occupancy in THE MART declined to 80.3% from 88.9%. However, occupancy in 555 California Street improved 70 bps to 94.9%.
Portfolio Activity
In the reported quarter, Vornado and Rudin closed the earlier announced transactions related to their 350 Park Avenue and 40 East 52nd Street properties with Citadel Enterprise Americas LLC (“Citadel”) and with an affiliate of Kenneth C. Griffin, Citadel’s Founder and CEO (“KG”).
Additionally, Vornado entered into a joint venture (JV) with Rudin (“Vornado/Rudin”) to purchase 39 East 51st Street for $40 million. Upon the formation of the KG JV, VNO intends to combine this property with 350 Park Avenue and 40 East 52nd Street to create a premier development site, to be known as “Site” collectively. The transaction is expected to be completed in second-quarter 2023.
Balance Sheet
Vornado exited first-quarter 2023 with cash and cash equivalents of $890.9 million, slightly up from $889.7 million as of Dec 31, 2022.
Vornado currently carries a Zacks Rank #3 (Hold).You can see the complete list of today’s Zacks #1 Rank (Strong Buy) stocks here.
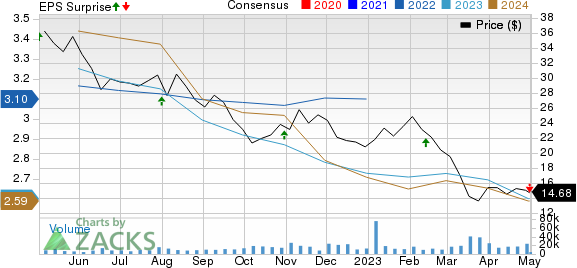
Vornado Realty Trust Price, Consensus and EPS Surprise
Vornado Realty Trust price-consensus-eps-surprise-chart | Vornado Realty Trust Quote
Performance of Other REITs
SL Green Realty Corp. SLG reported first-quarter 2023 FFO per share of $1.53, surpassing the Zacks Consensus Estimate of $1.42. It also beat our estimate of $1.39. The reported figure, however, fell 7.3% from the year-ago quarter’s $1.65.
SLG’s results reflected better-than-anticipated revenues. However, a fall in occupancy in Manhattan’s same-store office portfolio was a deterrent for the company in the first quarter.
Boston Properties Inc.’s BXP first-quarter 2023 FFO per share of $1.73 outpaced the Zacks Consensus Estimate of $1.70. It also surpassed our estimate of $1.68. However, the reported figure fell 4.9% year over year.
BXP’s quarterly results reflected better-than-anticipated revenues on healthy leasing activity. However, the company noted that higher interest expenses during the quarter marred its year-over-year FFO per share growth. BXP raised its outlook for 2023 FFO per share.
Cousins Properties’ CUZ first-quarter 2023 FFO per share of 65 cents beat the Zacks Consensus Estimate by a penny. It also surpassed our estimate of 63 cents. However, the figure declined from the prior-year quarter’s 67 cents.
CUZ's results reflected better-than-anticipated revenues, aided by healthy leasing activity and improvement in second-generation net rent per square foot. Yet, higher same-property rental property operating expenses acted as a dampener. The company also raised its 2023 FFO per share outlook.
Note: Anything related to earnings presented in this write-up represents FFO — a widely used metric to gauge the performance of REITs.
Want the latest recommendations from Zacks Investment Research? Today, you can download 7 Best Stocks for the Next 30 Days. Click to get this free report
Boston Properties, Inc. (BXP) : Free Stock Analysis Report
Vornado Realty Trust (VNO) : Free Stock Analysis Report
Cousins Properties Incorporated (CUZ) : Free Stock Analysis Report
SL Green Realty Corporation (SLG) : Free Stock Analysis Report

 Yahoo Finance

