
 Yahoo Finance
 Vivendi SE's Dividend Analysis
Understanding Vivendi SE's Dividend Dynamics
Vivendi SE (VIVHY) recently announced a dividend of $0.27 per share, payable on 2024-05-23, with the ex-dividend date set for 2024-05-01. As investors look forward to this upcoming payment, the spotlight also shines on the company's dividend history, yield, and growth rates. Using the data from GuruFocus, let's look into Vivendi SE's dividend performance and assess its sustainability.
What Does Vivendi SE Do?
This Powerful Chart Made Peter Lynch 29% A Year For 13 Years
How to calculate the intrinsic value of a stock?
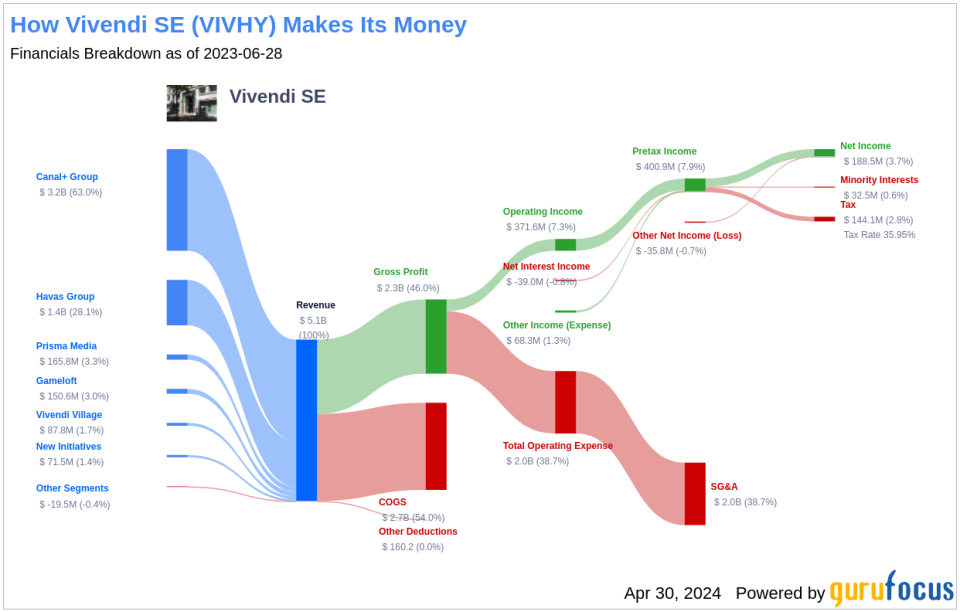
Vivendi SE is an integrated content, media, and communications group. The company operates businesses throughout the media value chain, from talent discovery to the creation, production, and distribution of content. The company now operates segments such as Canal+ Group, Lagardere, Havas, Prisma Media, Gameloft, Vivendi Village, New Initiatives, Generosity and Solidarity Corporate. It derives maximum revenue from Canal+ Group. The company operates geographically in France, Rest of Europe, Americas, Africa, and Asia/Oceania, out of which Africa derives key revenue.
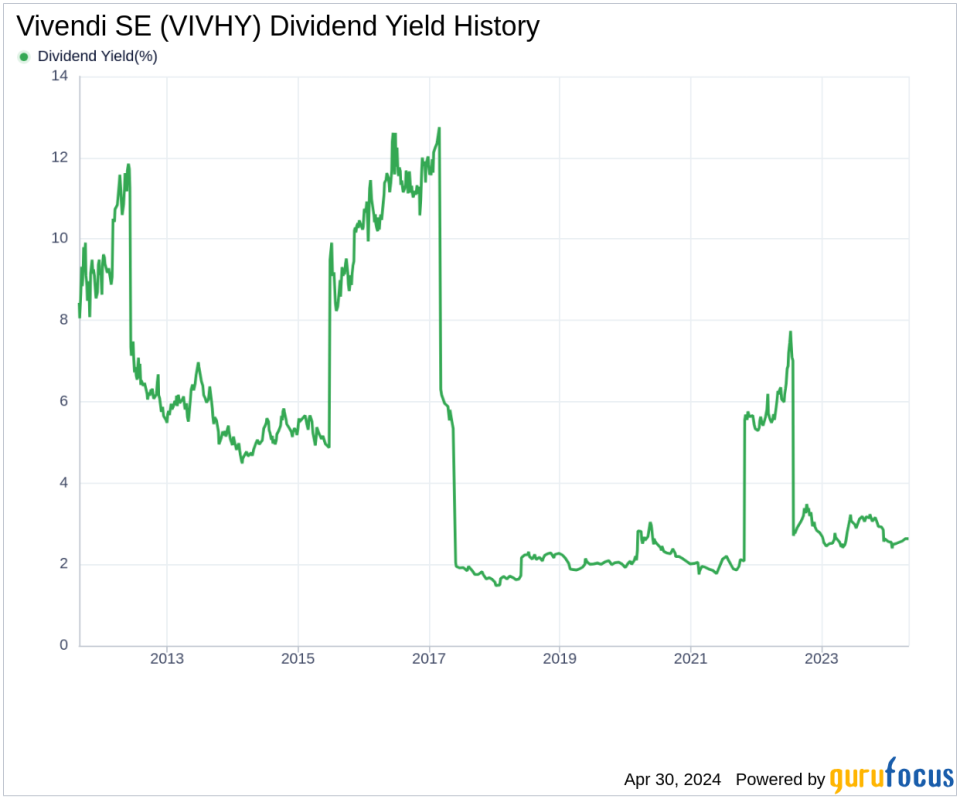
A Glimpse at Vivendi SE's Dividend History
Vivendi SE has maintained a consistent dividend payment record since 2011. Dividends are currently distributed on a yearly basis. Below is a chart showing annual Dividends Per Share for tracking historical trends.
Breaking Down Vivendi SE's Dividend Yield and Growth
As of today, Vivendi SE currently has a 12-month trailing dividend yield of 2.64% and a 12-month forward dividend yield of 2.57%. This suggests an expectation of decreased dividend payments over the next 12 months. Over the past three years, Vivendi SE's annual dividend growth rate was -25.30%. Extended to a five-year horizon, this rate increased to -13.40% per year. And over the past decade, Vivendi SE's annual dividends per share growth rate stands at -15.30%.
Based on Vivendi SE's dividend yield and five-year growth rate, the 5-year yield on cost of Vivendi SE stock as of today is approximately 1.29%.
The Sustainability Question: Payout Ratio and Profitability
To assess the sustainability of the dividend, one needs to evaluate the company's payout ratio. The dividend payout ratio provides insights into the portion of earnings the company distributes as dividends. A lower ratio suggests that the company retains a significant part of its earnings, thereby ensuring the availability of funds for future growth and unexpected downturns. As of 2023-12-31, Vivendi SE's dividend payout ratio is 0.35.
Vivendi SE's profitability rank, offers an understanding of the company's earnings prowess relative to its peers. GuruFocus ranks Vivendi SE's profitability 6 out of 10 as of 2023-12-31, suggesting fair profitability. The company has reported net profit in 9 years out of the past 10 years.
Growth Metrics: The Future Outlook
To ensure the sustainability of dividends, a company must have robust growth metrics. Vivendi SE's growth rank of 6 out of 10 suggests that the company has a fair growth outlook. Revenue is the lifeblood of any company, and Vivendi SE's revenue per share, combined with the 3-year revenue growth rate, indicates a strong revenue model. Vivendi SE's revenue has increased by approximately 10.60% per year on average, a rate that outperforms approximately 69.7% of global competitors.
The company's 3-year EPS growth rate showcases its capability to grow its earnings, a critical component for sustaining dividends in the long run. During the past three years, Vivendi SE's earnings increased by approximately -13.20% per year on average, a rate that outperforms approximately 26.98% of global competitors.
Lastly, the company's 5-year EBITDA growth rate of -16.50%, which outperforms approximately 14.1% of global competitors.
Next Steps
In conclusion, Vivendi SE's upcoming dividend payment, alongside its historical performance, presents a mixed picture for investors. While the dividend yield remains attractive, the declining growth rates raise questions about long-term sustainability. However, the company's solid profitability and fair growth outlook may offer some reassurance. Investors should weigh Vivendi SE's dividend payments, growth rate, payout ratio, profitability, and growth metrics carefully to make an informed decision. For those seeking to expand their portfolio with high-dividend yield stocks, GuruFocus Premium users can utilize the High Dividend Yield Screener for further research.
This article, generated by GuruFocus, is designed to provide general insights and is not tailored financial advice. Our commentary is rooted in historical data and analyst projections, utilizing an impartial methodology, and is not intended to serve as specific investment guidance. It does not formulate a recommendation to purchase or divest any stock and does not consider individual investment objectives or financial circumstances. Our objective is to deliver long-term, fundamental data-driven analysis. Be aware that our analysis might not incorporate the most recent, price-sensitive company announcements or qualitative information. GuruFocus holds no position in the stocks mentioned herein.
This article first appeared on GuruFocus.
