
 Yahoo Finance
 Vector (NZSE:VCT) Might Be Having Difficulty Using Its Capital Effectively
There are a few key trends to look for if we want to identify the next multi-bagger. Firstly, we'll want to see a proven return on capital employed (ROCE) that is increasing, and secondly, an expanding base of capital employed. Basically this means that a company has profitable initiatives that it can continue to reinvest in, which is a trait of a compounding machine. Having said that, from a first glance at Vector (NZSE:VCT) we aren't jumping out of our chairs at how returns are trending, but let's have a deeper look.
Return On Capital Employed (ROCE): What Is It?
For those that aren't sure what ROCE is, it measures the amount of pre-tax profits a company can generate from the capital employed in its business. To calculate this metric for Vector, this is the formula:
Return on Capital Employed = Earnings Before Interest and Tax (EBIT) ÷ (Total Assets - Current Liabilities)
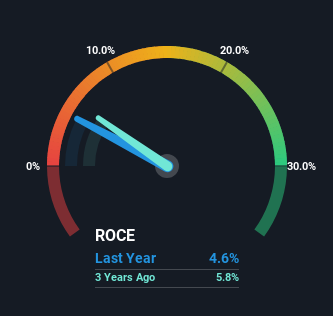
0.046 = NZ$312m ÷ (NZ$7.3b - NZ$505m) (Based on the trailing twelve months to December 2023).
So, Vector has an ROCE of 4.6%. On its own that's a low return on capital but it's in line with the industry's average returns of 5.2%.
See our latest analysis for Vector
In the above chart we have measured Vector's prior ROCE against its prior performance, but the future is arguably more important. If you'd like, you can check out the forecasts from the analysts covering Vector for free.
So How Is Vector's ROCE Trending?
On the surface, the trend of ROCE at Vector doesn't inspire confidence. Over the last five years, returns on capital have decreased to 4.6% from 6.5% five years ago. Although, given both revenue and the amount of assets employed in the business have increased, it could suggest the company is investing in growth, and the extra capital has led to a short-term reduction in ROCE. If these investments prove successful, this can bode very well for long term stock performance.
The Bottom Line
In summary, despite lower returns in the short term, we're encouraged to see that Vector is reinvesting for growth and has higher sales as a result. In light of this, the stock has only gained 30% over the last five years. So this stock may still be an appealing investment opportunity, if other fundamentals prove to be sound.
If you'd like to know more about Vector, we've spotted 3 warning signs, and 2 of them are a bit concerning.
While Vector may not currently earn the highest returns, we've compiled a list of companies that currently earn more than 25% return on equity. Check out this free list here.
Have feedback on this article? Concerned about the content? Get in touch with us directly. Alternatively, email editorial-team (at) simplywallst.com.
This article by Simply Wall St is general in nature. We provide commentary based on historical data and analyst forecasts only using an unbiased methodology and our articles are not intended to be financial advice. It does not constitute a recommendation to buy or sell any stock, and does not take account of your objectives, or your financial situation. We aim to bring you long-term focused analysis driven by fundamental data. Note that our analysis may not factor in the latest price-sensitive company announcements or qualitative material. Simply Wall St has no position in any stocks mentioned.
