
 Yahoo Finance
 Valley National (VLY) Q1 Earnings Miss on High Provisions
Valley National Bancorp’s VLY first-quarter 2024 adjusted earnings per share of 19 cents lagged the Zacks Consensus Estimate by a penny. The bottom line declined 36.7% on a year-over-year basis.
Results were adversely impacted by a rise in expenses and huge provisions. Further, lower net interest income (NII) due to rise deposit expenses, and fall in loans and deposits were spoilsports. However, a rise in non-interest income provided some relief.
Results excluded non-core income and charges. After considering these, net income available to common shareholders was $96.3 million or 18 cents per share, down from $146.6 million or 28 cents per share in the year-ago quarter.
Revenues Fall, Expenses Rise
Quarterly total revenues were $455 million, down 7.2% year over year. However, the top line surpassed the Zacks Consensus Estimate of $447.4 million.
NII (fully-taxable-equivalent or FTE basis) was $394.8 million, declining 9.7%. This was due to higher interest expenses. Net interest margin (FTE basis) was 2.79%, down 37 basis points.
Non-interest income was up 13.1% to $61.4 million. It included $3.6 million of gain on the sale of the premium finance division. Excluding this, adjusted non-interest income of $57.8 million, up 6.4%. The rise was largely driven by an increase in wealth management and trust fees and fees from loan servicing.
Non-interest expenses of $280.3 million increased 3%. Adjusted expenses rose 1.1% to $266.7 million.
The adjusted efficiency ratio was 59.10%, up from 53.79% in the prior year quarter. A rise in the efficiency ratio indicates a deterioration in profitability.
As of Mar 31, 2024, total loans were $50 billion, down marginally sequentially. As of the same date, total deposits amounted to $49.1 billion, declining slightly.
Credit Quality Worsens
As of Mar 31, 2024, total non-performing assets were $288.8 million, up 17.9% year over year. Provision for credit losses for loans was $45.3 million, rising substantially from $9.5 million.
Allowance for credit losses as a percentage of total loans was 0.98%, up from 0.95% in the year-ago quarter.
Profitability Ratios Deteriorate, Capital Ratios Improve
At the end of the first quarter, adjusted annualized return on average assets was 0.65%, down from 1.03% in the year-earlier quarter. Annualized return on average shareholders’ equity was 5.91%, down from 9.60%.
VLY's tangible common equity to tangible assets ratio was 7.62% as of Mar 31, 2024, up from 6.82% in the corresponding period of 2023. Tier 1 risk-based capital ratio was 9.78%, up from 9.46%. Also, the common equity tier 1 capital ratio of 9.34% was up from 9.03% as of Mar 31, 2023.
Conclusion
Valley National’s organic growth trajectory, strategic acquisitions and digitization efforts will support financials. However, persistently increasing costs and a challenging macroeconomic backdrop remain major concerns.
Further, the company’s huge commercial real estate loan (63.5% of total loans as of Mar 31, 2024) exposure is worrisome. This was also the primary reason that led to the drastic increase in provisions during the reported quarter.
Valley National Bancorp Price and Consensus
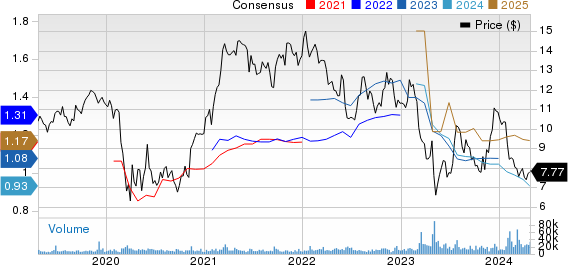
Valley National Bancorp price-consensus-chart | Valley National Bancorp Quote
Valley National currently carries a Zacks Rank #3 (Hold). You can see the complete list of today’s Zacks #1 Rank (Strong Buy) stocks here.
Performance of Other Banks
Prosperity Bancshares Inc.’s PB first-quarter 2024 earnings per share of $1.18 beat the Zacks Consensus Estimate of $1.15. However, the bottom line compared unfavorably with adjusted earnings of $1.38 in the prior-year quarter.
PB’s results benefited from nil provisions and an increase in non-interest income. Nevertheless, a fall in NII, along with rising expenses, was a major headwind.
East West Bancorp, Inc.’s EWBC first-quarter 2024 adjusted earnings per share of $2.08 surpassed the Zacks Consensus Estimate of $2.00. However, the bottom line declined 10.3% from the prior-year quarter.
EWBC’s results were primarily aided by an increase in non-interest income. Also, deposit balances increased sequentially in the quarter. However, lower NII and higher expenses and provisions were the undermining factors.
Want the latest recommendations from Zacks Investment Research? Today, you can download 7 Best Stocks for the Next 30 Days. Click to get this free report
Prosperity Bancshares, Inc. (PB) : Free Stock Analysis Report
East West Bancorp, Inc. (EWBC) : Free Stock Analysis Report
Valley National Bancorp (VLY) : Free Stock Analysis Report
