
 Yahoo Finance
 USD/JPY Technical Analysis – Resistance Seen Below 103.00
To receive Ilya's analysis directly via email, please SIGN UP HERE
Talking Points:
USD/JPY Technical Strategy: Flat
Support: 102.11 (23.6% Fib exp.), 101.52 (channel floor)
Resistance: 102.60 (38.2% Fib exp.), 103.00 (50% Fib exp.)
The US Dollar appreciated against the Japanese Yen as expected after the currency pair produced a bullish Morning Star candlestick pattern at channel support set from February. Buyers are aiming to challenge the 38.2% Fibonacci expansion at 102.60, with a break above that on a daily closing basis exposing the 50% level at 103.00. Alternatively, a turn back below the 38.2% Fib at 102.11 targets the channel floor, now at 101.52.
Prices are trading too close to relevant resistance to make a long trade attractive from a risk/reward perspective. On the other hand, the absence of a bearish reversal signal argues against taking up the short side. We will continue to stand aside for now, waiting for an actionable opportunity to present itself.
Confirm your chart-based trade setups with the Technical Analyzer. New to FX? Start Here!
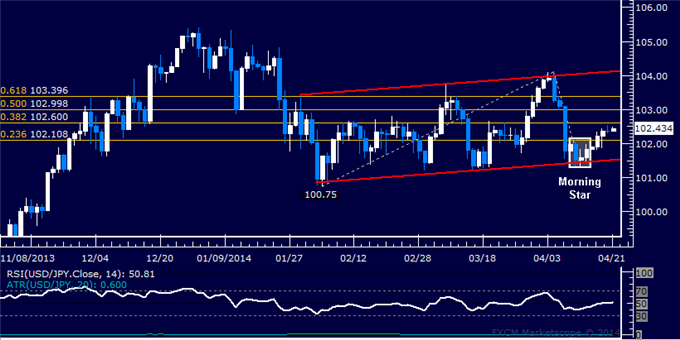
Daily Chart - Created Using FXCM Marketscope 2.0
--- Written by Ilya Spivak, Currency Strategist for DailyFX.com
DailyFX provides forex news and technical analysis on the trends that influence the global currency markets.
Learn forex trading with a free practice account and trading charts from FXCM.
