
 Yahoo Finance
 USD/JPY Near Term Levels Playing Out with Precision
DailyFX.com -
Daily
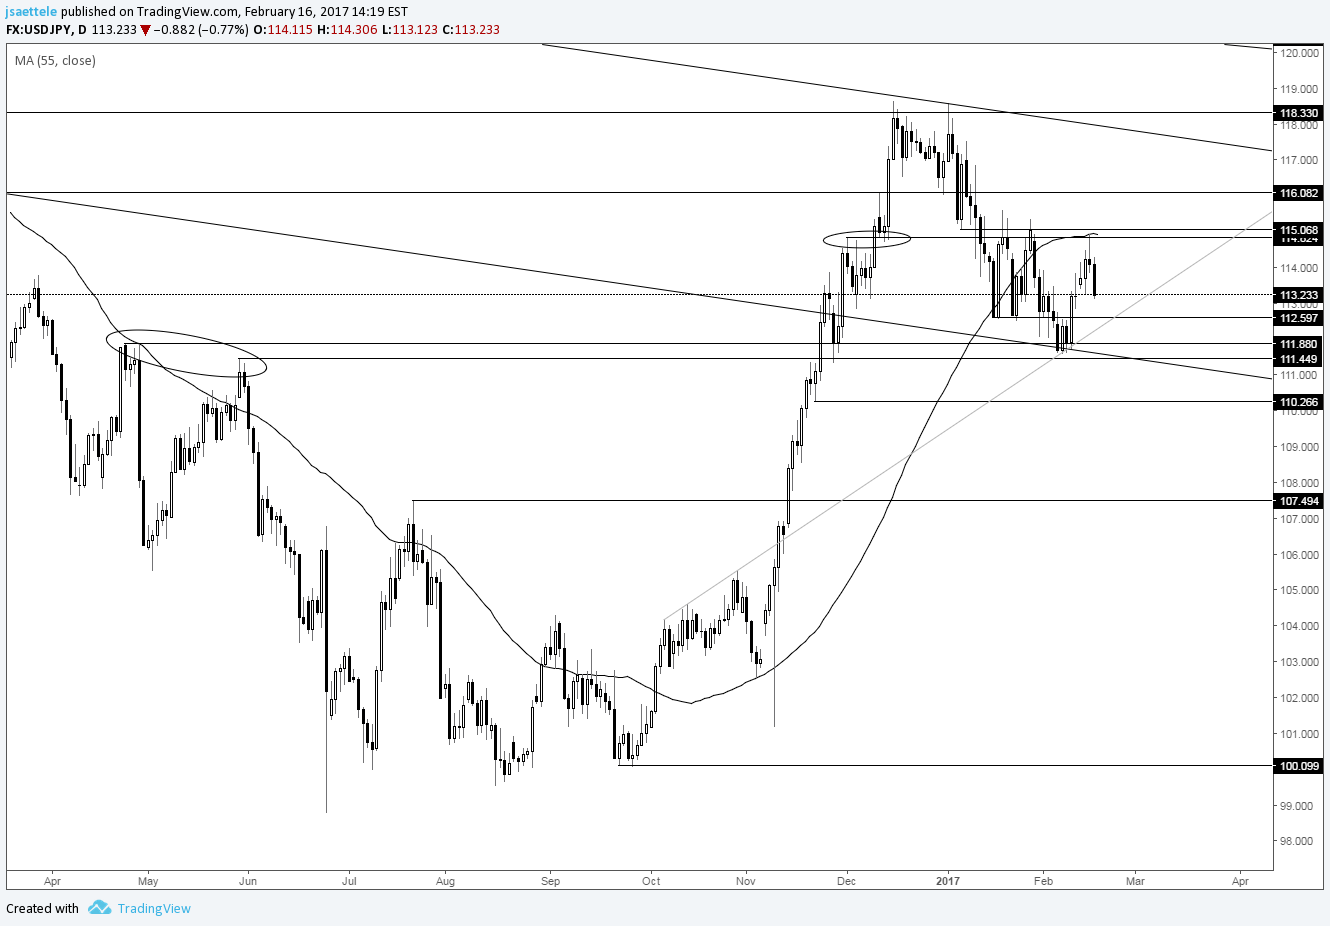
Chart Prepared by Jamie Saettele, CMT
DailyFX Trading Guides and Forecasts
-“114.80-115.10 should be watched for resistance”. USD/JPY topped in the zone on Wednesday (55 day average there too). From here, I’d watch for a higher low (above 111.58) to form as per prior comments regarding RSI. “The turn higher is viewed as sustainable for several reasons. First, price turned up from a well-defined price level. Second, daily RSI turned up from near 40, which is consistent with either bullish resumption of the bottom of a range. In contrast, bear market rallies turn up from deeply oversold conditions and are quickly retraced.”
DailyFX provides forex news and technical analysis on the trends that influence the global currency markets.
Learn forex trading with a free practice account and trading charts from IG.
