Advertisement
Australia markets closed
  • ALL ORDS

    7,837.40
    -100.10 (-1.26%)
     
  • ASX 200

    7,575.90
    -107.10 (-1.39%)
     
  • AUD/USD

    0.6535
    +0.0012 (+0.18%)
     
  • OIL

    83.66
    +0.09 (+0.11%)
     
  • GOLD

    2,349.60
    +7.10 (+0.30%)
     
  • Bitcoin AUD

    95,917.02
    -2,143.81 (-2.19%)
     
  • CMC Crypto 200

    1,316.60
    -79.93 (-5.72%)
     
  • AUD/EUR

    0.6108
    +0.0035 (+0.57%)
     
  • AUD/NZD

    1.0994
    +0.0037 (+0.33%)
     
  • NZX 50

    11,805.09
    -141.34 (-1.18%)
     
  • NASDAQ

    17,718.30
    +287.79 (+1.65%)
     
  • FTSE

    8,139.83
    +60.97 (+0.75%)
     
  • Dow Jones

    38,239.66
    +153.86 (+0.40%)
     
  • DAX

    18,161.01
    +243.73 (+1.36%)
     
  • Hang Seng

    17,651.15
    +366.61 (+2.12%)
     
  • NIKKEI 225

    37,934.76
    +306.28 (+0.81%)
     

USD/JPY Breaks 102.00 Handle Following Bullish Candlestick Pattern

Talking Points

  • USD/JPY Technical Strategy: Longs Preferred

  • Morning Starsuggests potential for a recovery

  • Dark Cloud Cover on 4 hour chart may see limited response

USD/JPY’s recovery may be set to continue based on a Morning Star formation on the daily which has received confirmation from a successive up day. The daily close above 102.00 favors longs with a potential target offered by former resistance at 102.70.

USD/JPY: Morning Star Supports Continued Recovery

USDJPY-Breaks-102.00-Handle-Following-Bullish-Candlestick-Pattern_body_Picture_2.png, USD/JPY Breaks 102.00 Handle Following Bullish Candlestick Pattern

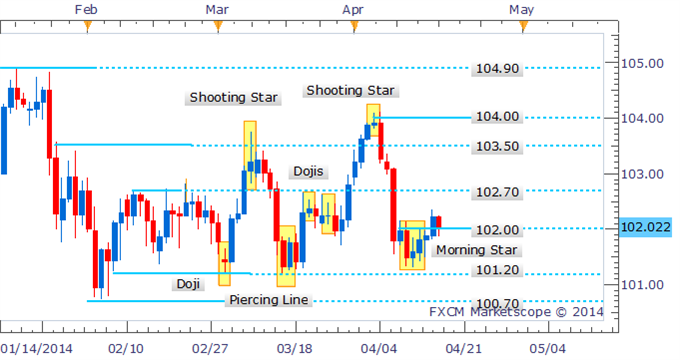
Daily Chart - Created Using FXCM Marketscope 2.0

Drilling down to examine the four hour chart; the Dark Cloud Cover formation may see little-follow through in the session ahead given the proximity to key support at 102.00.

ADVERTISEMENT

USD/JPY: Bulls May Support Prices At Critical 102.00 Handle

USDJPY-Breaks-102.00-Handle-Following-Bullish-Candlestick-Pattern_body_Picture_1.png, USD/JPY Breaks 102.00 Handle Following Bullish Candlestick Pattern

Four Hour Chart - Created Using FXCM Marketscope 2.0

By David de Ferranti, Market Analyst, FXCM

Follow David on Twitter: @Davidde

To receive David’s analysis directly via email, please sign up here.

Learn how to read candlesticks to help identify trading opportunities with the DailyFX Candlesticks Video Course.


original source

DailyFX provides forex news and technical analysis on the trends that influence the global currency markets.
Learn forex trading with a free practice account and trading charts from FXCM.