Advertisement
Australia markets closed
  • ALL ORDS

    7,837.40
    -100.10 (-1.26%)
     
  • ASX 200

    7,575.90
    -107.10 (-1.39%)
     
  • AUD/USD

    0.6548
    +0.0025 (+0.39%)
     
  • OIL

    84.09
    +0.52 (+0.62%)
     
  • GOLD

    2,357.70
    +15.20 (+0.65%)
     
  • Bitcoin AUD

    98,174.88
    +335.32 (+0.34%)
     
  • CMC Crypto 200

    1,388.56
    -7.97 (-0.57%)
     
  • AUD/EUR

    0.6097
    +0.0024 (+0.40%)
     
  • AUD/NZD

    1.0979
    +0.0021 (+0.19%)
     
  • NZX 50

    11,805.09
    -141.34 (-1.18%)
     
  • NASDAQ

    17,430.50
    -96.30 (-0.55%)
     
  • FTSE

    8,124.68
    +45.82 (+0.57%)
     
  • Dow Jones

    38,085.80
    -375.12 (-0.98%)
     
  • DAX

    18,025.38
    +108.10 (+0.60%)
     
  • Hang Seng

    17,668.79
    +384.25 (+2.22%)
     
  • NIKKEI 225

    37,934.76
    +306.28 (+0.81%)
     

USD/CAD Flyer Fails at Fibonacci

DailyFX.com -

Weekly

USD/CAD Flyer Fails at Fibonacci

Chart Prepared by Jamie Saettele, CMT

DailyFX Trading Guides and Forecasts

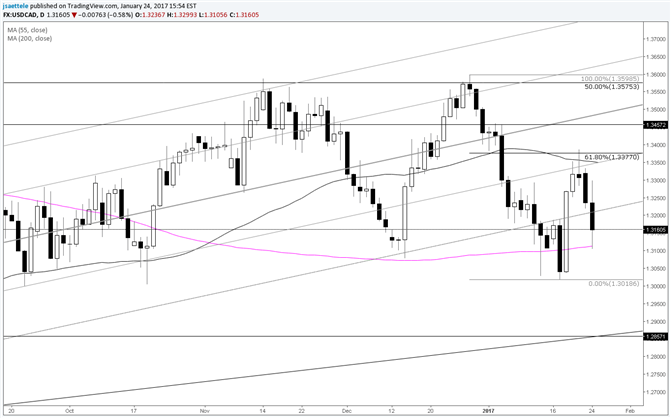
-The last update noted that “Captain Hindsight reveals that everyone got a little too bearish on the break of the trendline and 200 day average and the market had no choice but to do what it did. There is still the possibility of a breakdown. Watch 1.3376 and 1.3440/50s for resistance…” Top for the move was 1.3388, just above the 61.8% of the drop from 12/28. Today’s low is at the 200 day average. USD/CAD is stuck between 2 big technical levels. Ideally, a break of one of these levels will lead to a directional move.

ADVERTISEMENT


original source

DailyFX provides forex news and technical analysis on the trends that influence the global currency markets.
Learn forex trading with a free practice account and trading charts from IG.