
 Yahoo Finance
 UnitedHealth Group (NYSE:UNH) Hasn't Managed To Accelerate Its Returns
There are a few key trends to look for if we want to identify the next multi-bagger. Firstly, we'll want to see a proven return on capital employed (ROCE) that is increasing, and secondly, an expanding base of capital employed. If you see this, it typically means it's a company with a great business model and plenty of profitable reinvestment opportunities. That's why when we briefly looked at UnitedHealth Group's (NYSE:UNH) ROCE trend, we were pretty happy with what we saw.
Return On Capital Employed (ROCE): What Is It?
If you haven't worked with ROCE before, it measures the 'return' (pre-tax profit) a company generates from capital employed in its business. To calculate this metric for UnitedHealth Group, this is the formula:
Return on Capital Employed = Earnings Before Interest and Tax (EBIT) ÷ (Total Assets - Current Liabilities)
0.18 = US$30b ÷ (US$284b - US$116b) (Based on the trailing twelve months to March 2023).
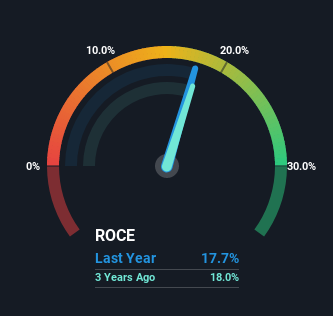
Therefore, UnitedHealth Group has an ROCE of 18%. In absolute terms, that's a satisfactory return, but compared to the Healthcare industry average of 9.5% it's much better.
See our latest analysis for UnitedHealth Group
Above you can see how the current ROCE for UnitedHealth Group compares to its prior returns on capital, but there's only so much you can tell from the past. If you'd like to see what analysts are forecasting going forward, you should check out our free report for UnitedHealth Group.
How Are Returns Trending?
The trend of ROCE doesn't stand out much, but returns on a whole are decent. The company has consistently earned 18% for the last five years, and the capital employed within the business has risen 90% in that time. Since 18% is a moderate ROCE though, it's good to see a business can continue to reinvest at these decent rates of return. Over long periods of time, returns like these might not be too exciting, but with consistency they can pay off in terms of share price returns.
On a side note, UnitedHealth Group's current liabilities are still rather high at 41% of total assets. This can bring about some risks because the company is basically operating with a rather large reliance on its suppliers or other sorts of short-term creditors. While it's not necessarily a bad thing, it can be beneficial if this ratio is lower.
Our Take On UnitedHealth Group's ROCE
The main thing to remember is that UnitedHealth Group has proven its ability to continually reinvest at respectable rates of return. On top of that, the stock has rewarded shareholders with a remarkable 113% return to those who've held over the last five years. So while the positive underlying trends may be accounted for by investors, we still think this stock is worth looking into further.
If you want to continue researching UnitedHealth Group, you might be interested to know about the 1 warning sign that our analysis has discovered.
If you want to search for solid companies with great earnings, check out this free list of companies with good balance sheets and impressive returns on equity.
Have feedback on this article? Concerned about the content? Get in touch with us directly. Alternatively, email editorial-team (at) simplywallst.com.
This article by Simply Wall St is general in nature. We provide commentary based on historical data and analyst forecasts only using an unbiased methodology and our articles are not intended to be financial advice. It does not constitute a recommendation to buy or sell any stock, and does not take account of your objectives, or your financial situation. We aim to bring you long-term focused analysis driven by fundamental data. Note that our analysis may not factor in the latest price-sensitive company announcements or qualitative material. Simply Wall St has no position in any stocks mentioned.
Join A Paid User Research Session
You’ll receive a US$30 Amazon Gift card for 1 hour of your time while helping us build better investing tools for the individual investors like yourself. Sign up here
