
 Yahoo Finance
 United Malt Group (ASX:UMG) Will Will Want To Turn Around Its Return Trends
To find a multi-bagger stock, what are the underlying trends we should look for in a business? Firstly, we'd want to identify a growing return on capital employed (ROCE) and then alongside that, an ever-increasing base of capital employed. This shows us that it's a compounding machine, able to continually reinvest its earnings back into the business and generate higher returns. Although, when we looked at United Malt Group (ASX:UMG), it didn't seem to tick all of these boxes.
What is Return On Capital Employed (ROCE)?
Just to clarify if you're unsure, ROCE is a metric for evaluating how much pre-tax income (in percentage terms) a company earns on the capital invested in its business. Analysts use this formula to calculate it for United Malt Group:
Return on Capital Employed = Earnings Before Interest and Tax (EBIT) ÷ (Total Assets - Current Liabilities)
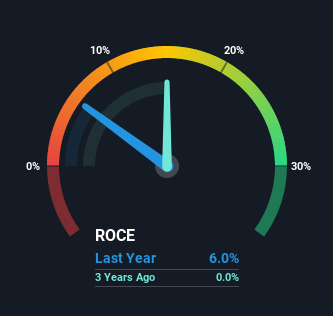
0.06 = AU$95m ÷ (AU$1.9b - AU$317m) (Based on the trailing twelve months to September 2020).
Thus, United Malt Group has an ROCE of 6.0%. Even though it's in line with the industry average of 6.2%, it's still a low return by itself.
Check out our latest analysis for United Malt Group
Above you can see how the current ROCE for United Malt Group compares to its prior returns on capital, but there's only so much you can tell from the past. If you'd like to see what analysts are forecasting going forward, you should check out our free report for United Malt Group.
What Does the ROCE Trend For United Malt Group Tell Us?
We weren't thrilled with the trend because United Malt Group's ROCE has reduced by 62% over the last one year, while the business employed 96% more capital. That being said, United Malt Group raised some capital prior to their latest results being released, so that could partly explain the increase in capital employed. The funds raised likely haven't been put to work yet so it's worth watching what happens in the future with United Malt Group's earnings and if they change as a result from the capital raise.
On a related note, United Malt Group has decreased its current liabilities to 17% of total assets. That could partly explain why the ROCE has dropped. What's more, this can reduce some aspects of risk to the business because now the company's suppliers or short-term creditors are funding less of its operations. Since the business is basically funding more of its operations with it's own money, you could argue this has made the business less efficient at generating ROCE.
The Key Takeaway
In summary, United Malt Group is reinvesting funds back into the business for growth but unfortunately it looks like sales haven't increased much just yet. Since the stock has gained an impressive 10% over the last year, investors must think there's better things to come. But if the trajectory of these underlying trends continue, we think the likelihood of it being a multi-bagger from here isn't high.
One more thing, we've spotted 2 warning signs facing United Malt Group that you might find interesting.
For those who like to invest in solid companies, check out this free list of companies with solid balance sheets and high returns on equity.
This article by Simply Wall St is general in nature. It does not constitute a recommendation to buy or sell any stock, and does not take account of your objectives, or your financial situation. We aim to bring you long-term focused analysis driven by fundamental data. Note that our analysis may not factor in the latest price-sensitive company announcements or qualitative material. Simply Wall St has no position in any stocks mentioned.
Have feedback on this article? Concerned about the content? Get in touch with us directly. Alternatively, email editorial-team (at) simplywallst.com.
