
 Yahoo Finance
 We Like These Underlying Return On Capital Trends At Turbon (FRA:TUR)
What trends should we look for it we want to identify stocks that can multiply in value over the long term? Ideally, a business will show two trends; firstly a growing return on capital employed (ROCE) and secondly, an increasing amount of capital employed. This shows us that it's a compounding machine, able to continually reinvest its earnings back into the business and generate higher returns. Speaking of which, we noticed some great changes in Turbon's (FRA:TUR) returns on capital, so let's have a look.
What Is Return On Capital Employed (ROCE)?
If you haven't worked with ROCE before, it measures the 'return' (pre-tax profit) a company generates from capital employed in its business. To calculate this metric for Turbon, this is the formula:
Return on Capital Employed = Earnings Before Interest and Tax (EBIT) ÷ (Total Assets - Current Liabilities)
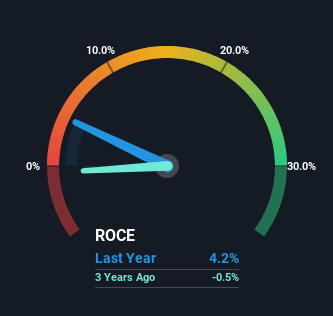
0.042 = €1.6m ÷ (€46m - €9.9m) (Based on the trailing twelve months to June 2023).
So, Turbon has an ROCE of 4.2%. Ultimately, that's a low return and it under-performs the Commercial Services industry average of 7.7%.
See our latest analysis for Turbon
While the past is not representative of the future, it can be helpful to know how a company has performed historically, which is why we have this chart above. If you're interested in investigating Turbon's past further, check out this free graph of past earnings, revenue and cash flow.
What The Trend Of ROCE Can Tell Us
While there are companies with higher returns on capital out there, we still find the trend at Turbon promising. The figures show that over the last five years, ROCE has grown 572% whilst employing roughly the same amount of capital. So it's likely that the business is now reaping the full benefits of its past investments, since the capital employed hasn't changed considerably. The company is doing well in that sense, and it's worth investigating what the management team has planned for long term growth prospects.
On a related note, the company's ratio of current liabilities to total assets has decreased to 21%, which basically reduces it's funding from the likes of short-term creditors or suppliers. So shareholders would be pleased that the growth in returns has mostly come from underlying business performance.
Our Take On Turbon's ROCE
As discussed above, Turbon appears to be getting more proficient at generating returns since capital employed has remained flat but earnings (before interest and tax) are up. Since the total return from the stock has been almost flat over the last five years, there might be an opportunity here if the valuation looks good. With that in mind, we believe the promising trends warrant this stock for further investigation.
Turbon does have some risks, we noticed 5 warning signs (and 1 which shouldn't be ignored) we think you should know about.
If you want to search for solid companies with great earnings, check out this free list of companies with good balance sheets and impressive returns on equity.
Have feedback on this article? Concerned about the content? Get in touch with us directly. Alternatively, email editorial-team (at) simplywallst.com.
This article by Simply Wall St is general in nature. We provide commentary based on historical data and analyst forecasts only using an unbiased methodology and our articles are not intended to be financial advice. It does not constitute a recommendation to buy or sell any stock, and does not take account of your objectives, or your financial situation. We aim to bring you long-term focused analysis driven by fundamental data. Note that our analysis may not factor in the latest price-sensitive company announcements or qualitative material. Simply Wall St has no position in any stocks mentioned.
