
 Yahoo Finance
 We Like These Underlying Return On Capital Trends At RHÖN-KLINIKUM (ETR:RHK)
Finding a business that has the potential to grow substantially is not easy, but it is possible if we look at a few key financial metrics. Firstly, we'd want to identify a growing return on capital employed (ROCE) and then alongside that, an ever-increasing base of capital employed. This shows us that it's a compounding machine, able to continually reinvest its earnings back into the business and generate higher returns. With that in mind, we've noticed some promising trends at RHÖN-KLINIKUM (ETR:RHK) so let's look a bit deeper.
Understanding Return On Capital Employed (ROCE)
For those who don't know, ROCE is a measure of a company's yearly pre-tax profit (its return), relative to the capital employed in the business. To calculate this metric for RHÖN-KLINIKUM, this is the formula:
Return on Capital Employed = Earnings Before Interest and Tax (EBIT) ÷ (Total Assets - Current Liabilities)
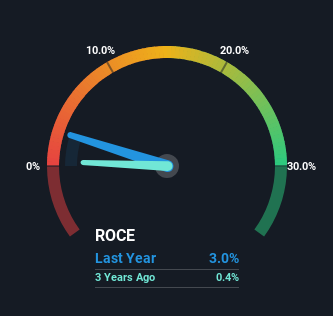
0.03 = €43m ÷ (€1.8b - €365m) (Based on the trailing twelve months to March 2024).
So, RHÖN-KLINIKUM has an ROCE of 3.0%. Ultimately, that's a low return and it under-performs the Healthcare industry average of 6.0%.
View our latest analysis for RHÖN-KLINIKUM
In the above chart we have measured RHÖN-KLINIKUM's prior ROCE against its prior performance, but the future is arguably more important. If you're interested, you can view the analysts predictions in our free analyst report for RHÖN-KLINIKUM .
How Are Returns Trending?
Even though ROCE is still low in absolute terms, it's good to see it's heading in the right direction. Looking at the data, we can see that even though capital employed in the business has remained relatively flat, the ROCE generated has risen by 54% over the last five years. Basically the business is generating higher returns from the same amount of capital and that is proof that there are improvements in the company's efficiencies. It's worth looking deeper into this though because while it's great that the business is more efficient, it might also mean that going forward the areas to invest internally for the organic growth are lacking.
What We Can Learn From RHÖN-KLINIKUM's ROCE
To bring it all together, RHÖN-KLINIKUM has done well to increase the returns it's generating from its capital employed. Astute investors may have an opportunity here because the stock has declined 51% in the last five years. That being the case, research into the company's current valuation metrics and future prospects seems fitting.
On the other side of ROCE, we have to consider valuation. That's why we have a FREE intrinsic value estimation for RHK on our platform that is definitely worth checking out.
While RHÖN-KLINIKUM may not currently earn the highest returns, we've compiled a list of companies that currently earn more than 25% return on equity. Check out this free list here.
Have feedback on this article? Concerned about the content? Get in touch with us directly. Alternatively, email editorial-team (at) simplywallst.com.
This article by Simply Wall St is general in nature. We provide commentary based on historical data and analyst forecasts only using an unbiased methodology and our articles are not intended to be financial advice. It does not constitute a recommendation to buy or sell any stock, and does not take account of your objectives, or your financial situation. We aim to bring you long-term focused analysis driven by fundamental data. Note that our analysis may not factor in the latest price-sensitive company announcements or qualitative material. Simply Wall St has no position in any stocks mentioned.
