
 Yahoo Finance
 We Like These Underlying Return On Capital Trends At Omni-Lite Industries Canada (CVE:OML)
If you're looking for a multi-bagger, there's a few things to keep an eye out for. One common approach is to try and find a company with returns on capital employed (ROCE) that are increasing, in conjunction with a growing amount of capital employed. This shows us that it's a compounding machine, able to continually reinvest its earnings back into the business and generate higher returns. Speaking of which, we noticed some great changes in Omni-Lite Industries Canada's (CVE:OML) returns on capital, so let's have a look.
What Is Return On Capital Employed (ROCE)?
If you haven't worked with ROCE before, it measures the 'return' (pre-tax profit) a company generates from capital employed in its business. Analysts use this formula to calculate it for Omni-Lite Industries Canada:
Return on Capital Employed = Earnings Before Interest and Tax (EBIT) ÷ (Total Assets - Current Liabilities)
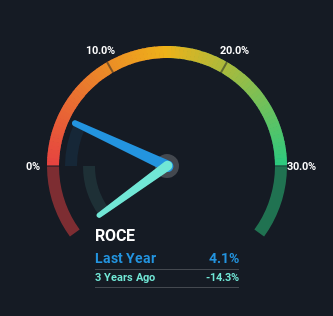
0.041 = US$797k ÷ (US$21m - US$2.0m) (Based on the trailing twelve months to December 2023).
Therefore, Omni-Lite Industries Canada has an ROCE of 4.1%. In absolute terms, that's a low return and it also under-performs the Machinery industry average of 9.6%.
See our latest analysis for Omni-Lite Industries Canada
While the past is not representative of the future, it can be helpful to know how a company has performed historically, which is why we have this chart above. If you'd like to look at how Omni-Lite Industries Canada has performed in the past in other metrics, you can view this free graph of Omni-Lite Industries Canada's past earnings, revenue and cash flow.
What Does the ROCE Trend For Omni-Lite Industries Canada Tell Us?
Omni-Lite Industries Canada has broken into the black (profitability) and we're sure it's a sight for sore eyes. The company was generating losses five years ago, but has managed to turn it around and as we saw earlier is now earning 4.1%, which is always encouraging. Interestingly, the capital employed by the business has remained relatively flat, so these higher returns are either from prior investments paying off or increased efficiencies. That being said, while an increase in efficiency is no doubt appealing, it'd be helpful to know if the company does have any investment plans going forward. After all, a company can only become a long term multi-bagger if it continually reinvests in itself at high rates of return.
The Bottom Line
In summary, we're delighted to see that Omni-Lite Industries Canada has been able to increase efficiencies and earn higher rates of return on the same amount of capital. And given the stock has remained rather flat over the last five years, there might be an opportunity here if other metrics are strong. So researching this company further and determining whether or not these trends will continue seems justified.
One more thing: We've identified 2 warning signs with Omni-Lite Industries Canada (at least 1 which is potentially serious) , and understanding them would certainly be useful.
If you want to search for solid companies with great earnings, check out this free list of companies with good balance sheets and impressive returns on equity.
Have feedback on this article? Concerned about the content? Get in touch with us directly. Alternatively, email editorial-team (at) simplywallst.com.
This article by Simply Wall St is general in nature. We provide commentary based on historical data and analyst forecasts only using an unbiased methodology and our articles are not intended to be financial advice. It does not constitute a recommendation to buy or sell any stock, and does not take account of your objectives, or your financial situation. We aim to bring you long-term focused analysis driven by fundamental data. Note that our analysis may not factor in the latest price-sensitive company announcements or qualitative material. Simply Wall St has no position in any stocks mentioned.
