
 Yahoo Finance
 We Like These Underlying Return On Capital Trends At Dalrymple Bay Infrastructure (ASX:DBI)
There are a few key trends to look for if we want to identify the next multi-bagger. One common approach is to try and find a company with returns on capital employed (ROCE) that are increasing, in conjunction with a growing amount of capital employed. This shows us that it's a compounding machine, able to continually reinvest its earnings back into the business and generate higher returns. With that in mind, we've noticed some promising trends at Dalrymple Bay Infrastructure (ASX:DBI) so let's look a bit deeper.
Return On Capital Employed (ROCE): What is it?
Just to clarify if you're unsure, ROCE is a metric for evaluating how much pre-tax income (in percentage terms) a company earns on the capital invested in its business. Analysts use this formula to calculate it for Dalrymple Bay Infrastructure:
Return on Capital Employed = Earnings Before Interest and Tax (EBIT) ÷ (Total Assets - Current Liabilities)
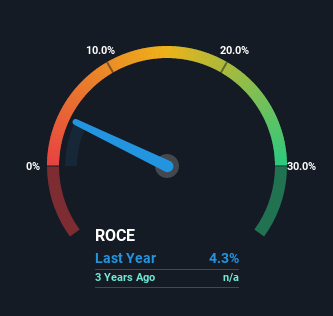
0.043 = AU$148m ÷ (AU$3.5b - AU$76m) (Based on the trailing twelve months to December 2021).
Therefore, Dalrymple Bay Infrastructure has an ROCE of 4.3%. Even though it's in line with the industry average of 4.3%, it's still a low return by itself.
View our latest analysis for Dalrymple Bay Infrastructure
Above you can see how the current ROCE for Dalrymple Bay Infrastructure compares to its prior returns on capital, but there's only so much you can tell from the past. If you'd like, you can check out the forecasts from the analysts covering Dalrymple Bay Infrastructure here for free.
What Does the ROCE Trend For Dalrymple Bay Infrastructure Tell Us?
While the ROCE isn't as high as some other companies out there, it's great to see it's on the up. Looking at the data, we can see that even though capital employed in the business has remained relatively flat, the ROCE generated has risen by 36% over the last one year. Basically the business is generating higher returns from the same amount of capital and that is proof that there are improvements in the company's efficiencies. On that front, things are looking good so it's worth exploring what management has said about growth plans going forward.
The Bottom Line On Dalrymple Bay Infrastructure's ROCE
In summary, we're delighted to see that Dalrymple Bay Infrastructure has been able to increase efficiencies and earn higher rates of return on the same amount of capital. Since the stock has only returned 1.8% to shareholders over the last year, the promising fundamentals may not be recognized yet by investors. Given that, we'd look further into this stock in case it has more traits that could make it multiply in the long term.
If you want to know some of the risks facing Dalrymple Bay Infrastructure we've found 3 warning signs (2 are a bit unpleasant!) that you should be aware of before investing here.
For those who like to invest in solid companies, check out this free list of companies with solid balance sheets and high returns on equity.
Have feedback on this article? Concerned about the content? Get in touch with us directly. Alternatively, email editorial-team (at) simplywallst.com.
This article by Simply Wall St is general in nature. We provide commentary based on historical data and analyst forecasts only using an unbiased methodology and our articles are not intended to be financial advice. It does not constitute a recommendation to buy or sell any stock, and does not take account of your objectives, or your financial situation. We aim to bring you long-term focused analysis driven by fundamental data. Note that our analysis may not factor in the latest price-sensitive company announcements or qualitative material. Simply Wall St has no position in any stocks mentioned.
