
 Yahoo Finance
 Under The Bonnet, Tigers Realm Coal's (ASX:TIG) Returns Look Impressive
If we want to find a potential multi-bagger, often there are underlying trends that can provide clues. Firstly, we'd want to identify a growing return on capital employed (ROCE) and then alongside that, an ever-increasing base of capital employed. Put simply, these types of businesses are compounding machines, meaning they are continually reinvesting their earnings at ever-higher rates of return. With that in mind, the ROCE of Tigers Realm Coal (ASX:TIG) looks great, so lets see what the trend can tell us.
Understanding Return On Capital Employed (ROCE)
For those who don't know, ROCE is a measure of a company's yearly pre-tax profit (its return), relative to the capital employed in the business. The formula for this calculation on Tigers Realm Coal is:
Return on Capital Employed = Earnings Before Interest and Tax (EBIT) ÷ (Total Assets - Current Liabilities)
0.28 = AU$41m ÷ (AU$166m - AU$18m) (Based on the trailing twelve months to December 2021).
So, Tigers Realm Coal has an ROCE of 28%. In absolute terms that's a great return and it's even better than the Metals and Mining industry average of 8.7%.
Check out our latest analysis for Tigers Realm Coal
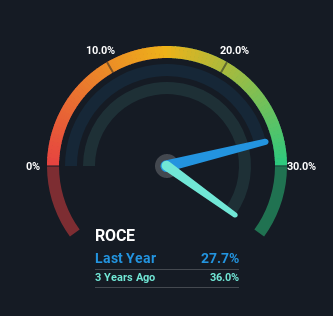
Historical performance is a great place to start when researching a stock so above you can see the gauge for Tigers Realm Coal's ROCE against it's prior returns. If you want to delve into the historical earnings, revenue and cash flow of Tigers Realm Coal, check out these free graphs here.
What Can We Tell From Tigers Realm Coal's ROCE Trend?
The fact that Tigers Realm Coal is now generating some pre-tax profits from its prior investments is very encouraging. About five years ago the company was generating losses but things have turned around because it's now earning 28% on its capital. In addition to that, Tigers Realm Coal is employing 492% more capital than previously which is expected of a company that's trying to break into profitability. This can indicate that there's plenty of opportunities to invest capital internally and at ever higher rates, both common traits of a multi-bagger.
The Key Takeaway
Long story short, we're delighted to see that Tigers Realm Coal's reinvestment activities have paid off and the company is now profitable. Astute investors may have an opportunity here because the stock has declined 60% in the last five years. That being the case, research into the company's current valuation metrics and future prospects seems fitting.
Since virtually every company faces some risks, it's worth knowing what they are, and we've spotted 2 warning signs for Tigers Realm Coal (of which 1 is concerning!) that you should know about.
If you want to search for more stocks that have been earning high returns, check out this free list of stocks with solid balance sheets that are also earning high returns on equity.
Have feedback on this article? Concerned about the content? Get in touch with us directly. Alternatively, email editorial-team (at) simplywallst.com.
This article by Simply Wall St is general in nature. We provide commentary based on historical data and analyst forecasts only using an unbiased methodology and our articles are not intended to be financial advice. It does not constitute a recommendation to buy or sell any stock, and does not take account of your objectives, or your financial situation. We aim to bring you long-term focused analysis driven by fundamental data. Note that our analysis may not factor in the latest price-sensitive company announcements or qualitative material. Simply Wall St has no position in any stocks mentioned.
