
 Yahoo Finance
 Under The Bonnet, Mulberry Group's (LON:MUL) Returns Look Impressive
If you're looking for a multi-bagger, there's a few things to keep an eye out for. Firstly, we'll want to see a proven return on capital employed (ROCE) that is increasing, and secondly, an expanding base of capital employed. This shows us that it's a compounding machine, able to continually reinvest its earnings back into the business and generate higher returns. And in light of that, the trends we're seeing at Mulberry Group's (LON:MUL) look very promising so lets take a look.
What is Return On Capital Employed (ROCE)?
For those who don't know, ROCE is a measure of a company's yearly pre-tax profit (its return), relative to the capital employed in the business. Analysts use this formula to calculate it for Mulberry Group:
Return on Capital Employed = Earnings Before Interest and Tax (EBIT) ÷ (Total Assets - Current Liabilities)
0.21 = UK£18m ÷ (UK£131m - UK£44m) (Based on the trailing twelve months to September 2021).
Therefore, Mulberry Group has an ROCE of 21%. On its own, that's a very good return and it's on par with the returns earned by companies in a similar industry.
See our latest analysis for Mulberry Group
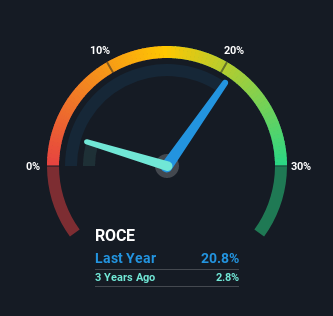
Historical performance is a great place to start when researching a stock so above you can see the gauge for Mulberry Group's ROCE against it's prior returns. If you'd like to look at how Mulberry Group has performed in the past in other metrics, you can view this free graph of past earnings, revenue and cash flow.
So How Is Mulberry Group's ROCE Trending?
Mulberry Group has not disappointed with their ROCE growth. Looking at the data, we can see that even though capital employed in the business has remained relatively flat, the ROCE generated has risen by 183% over the last five years. So our take on this is that the business has increased efficiencies to generate these higher returns, all the while not needing to make any additional investments. The company is doing well in that sense, and it's worth investigating what the management team has planned for long term growth prospects.
The Bottom Line On Mulberry Group's ROCE
As discussed above, Mulberry Group appears to be getting more proficient at generating returns since capital employed has remained flat but earnings (before interest and tax) are up. And since the stock has dived 72% over the last five years, there may be other factors affecting the company's prospects. In any case, we believe the economic trends of this company are positive and looking into the stock further could prove rewarding.
If you'd like to know about the risks facing Mulberry Group, we've discovered 2 warning signs that you should be aware of.
If you'd like to see other companies earning high returns, check out our free list of companies earning high returns with solid balance sheets here.
Have feedback on this article? Concerned about the content? Get in touch with us directly. Alternatively, email editorial-team (at) simplywallst.com.
This article by Simply Wall St is general in nature. We provide commentary based on historical data and analyst forecasts only using an unbiased methodology and our articles are not intended to be financial advice. It does not constitute a recommendation to buy or sell any stock, and does not take account of your objectives, or your financial situation. We aim to bring you long-term focused analysis driven by fundamental data. Note that our analysis may not factor in the latest price-sensitive company announcements or qualitative material. Simply Wall St has no position in any stocks mentioned.
