
 Yahoo Finance
 Under The Bonnet, Bisalloy Steel Group's (ASX:BIS) Returns Look Impressive
If we want to find a stock that could multiply over the long term, what are the underlying trends we should look for? Amongst other things, we'll want to see two things; firstly, a growing return on capital employed (ROCE) and secondly, an expansion in the company's amount of capital employed. If you see this, it typically means it's a company with a great business model and plenty of profitable reinvestment opportunities. With that in mind, the ROCE of Bisalloy Steel Group (ASX:BIS) looks great, so lets see what the trend can tell us.
What Is Return On Capital Employed (ROCE)?
Just to clarify if you're unsure, ROCE is a metric for evaluating how much pre-tax income (in percentage terms) a company earns on the capital invested in its business. To calculate this metric for Bisalloy Steel Group, this is the formula:
Return on Capital Employed = Earnings Before Interest and Tax (EBIT) ÷ (Total Assets - Current Liabilities)
0.24 = AU$19m ÷ (AU$117m - AU$37m) (Based on the trailing twelve months to December 2023).
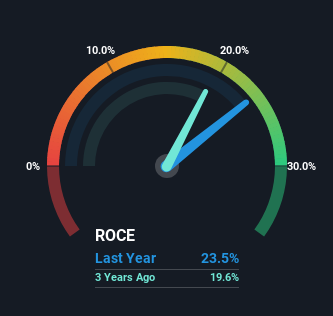
Thus, Bisalloy Steel Group has an ROCE of 24%. In absolute terms that's a great return and it's even better than the Metals and Mining industry average of 11%.
Check out our latest analysis for Bisalloy Steel Group
While the past is not representative of the future, it can be helpful to know how a company has performed historically, which is why we have this chart above. If you want to delve into the historical earnings , check out these free graphs detailing revenue and cash flow performance of Bisalloy Steel Group.
How Are Returns Trending?
Bisalloy Steel Group is displaying some positive trends. The numbers show that in the last five years, the returns generated on capital employed have grown considerably to 24%. The amount of capital employed has increased too, by 106%. So we're very much inspired by what we're seeing at Bisalloy Steel Group thanks to its ability to profitably reinvest capital.
In another part of our analysis, we noticed that the company's ratio of current liabilities to total assets decreased to 31%, which broadly means the business is relying less on its suppliers or short-term creditors to fund its operations. Therefore we can rest assured that the growth in ROCE is a result of the business' fundamental improvements, rather than a cooking class featuring this company's books.
In Conclusion...
In summary, it's great to see that Bisalloy Steel Group can compound returns by consistently reinvesting capital at increasing rates of return, because these are some of the key ingredients of those highly sought after multi-baggers. Since the stock has returned a staggering 249% to shareholders over the last five years, it looks like investors are recognizing these changes. Therefore, we think it would be worth your time to check if these trends are going to continue.
If you'd like to know about the risks facing Bisalloy Steel Group, we've discovered 2 warning signs that you should be aware of.
High returns are a key ingredient to strong performance, so check out our free list ofstocks earning high returns on equity with solid balance sheets.
Have feedback on this article? Concerned about the content? Get in touch with us directly. Alternatively, email editorial-team (at) simplywallst.com.
This article by Simply Wall St is general in nature. We provide commentary based on historical data and analyst forecasts only using an unbiased methodology and our articles are not intended to be financial advice. It does not constitute a recommendation to buy or sell any stock, and does not take account of your objectives, or your financial situation. We aim to bring you long-term focused analysis driven by fundamental data. Note that our analysis may not factor in the latest price-sensitive company announcements or qualitative material. Simply Wall St has no position in any stocks mentioned.
