
 Yahoo Finance
 TZ Limited (ASX:TZL) Doing What It Can To Lift Shares
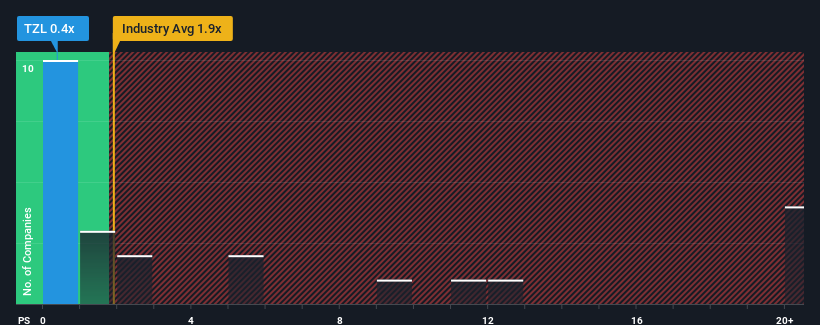
You may think that with a price-to-sales (or "P/S") ratio of 0.4x TZ Limited (ASX:TZL) is a stock worth checking out, seeing as almost half of all the Electronic companies in Australia have P/S ratios greater than 1.9x and even P/S higher than 11x aren't out of the ordinary. However, the P/S might be low for a reason and it requires further investigation to determine if it's justified.
Check out our latest analysis for TZ
How TZ Has Been Performing
With revenue growth that's exceedingly strong of late, TZ has been doing very well. It might be that many expect the strong revenue performance to degrade substantially, which has repressed the P/S ratio. If you like the company, you'd be hoping this isn't the case so that you could potentially pick up some stock while it's out of favour.
We don't have analyst forecasts, but you can see how recent trends are setting up the company for the future by checking out our free report on TZ's earnings, revenue and cash flow.
Do Revenue Forecasts Match The Low P/S Ratio?
The only time you'd be truly comfortable seeing a P/S as low as TZ's is when the company's growth is on track to lag the industry.
Retrospectively, the last year delivered an exceptional 45% gain to the company's top line. The latest three year period has also seen an excellent 49% overall rise in revenue, aided by its short-term performance. Accordingly, shareholders would have definitely welcomed those medium-term rates of revenue growth.
Weighing that recent medium-term revenue trajectory against the broader industry's one-year forecast for expansion of 13% shows it's about the same on an annualised basis.
In light of this, it's peculiar that TZ's P/S sits below the majority of other companies. It may be that most investors are not convinced the company can maintain recent growth rates.
The Bottom Line On TZ's P/S
Generally, our preference is to limit the use of the price-to-sales ratio to establishing what the market thinks about the overall health of a company.
Our examination of TZ revealed its three-year revenue trends looking similar to current industry expectations hasn't given the P/S the boost we expected, given that it's lower than the wider industry P/S, When we see industry-like revenue growth but a lower than expected P/S, we assume potential risks are what might be placing downward pressure on the share price. medium-term
And what about other risks? Every company has them, and we've spotted 5 warning signs for TZ (of which 3 can't be ignored!) you should know about.
Of course, profitable companies with a history of great earnings growth are generally safer bets. So you may wish to see this free collection of other companies that have reasonable P/E ratios and have grown earnings strongly.
Have feedback on this article? Concerned about the content? Get in touch with us directly. Alternatively, email editorial-team (at) simplywallst.com.
This article by Simply Wall St is general in nature. We provide commentary based on historical data and analyst forecasts only using an unbiased methodology and our articles are not intended to be financial advice. It does not constitute a recommendation to buy or sell any stock, and does not take account of your objectives, or your financial situation. We aim to bring you long-term focused analysis driven by fundamental data. Note that our analysis may not factor in the latest price-sensitive company announcements or qualitative material. Simply Wall St has no position in any stocks mentioned.
Join A Paid User Research Session
You’ll receive a US$30 Amazon Gift card for 1 hour of your time while helping us build better investing tools for the individual investors like yourself. Sign up here
