
 Yahoo Finance
 What Type Of Returns Would Incitec Pivot's(ASX:IPL) Shareholders Have Earned If They Purchased Their SharesFive Years Ago?
Incitec Pivot Limited (ASX:IPL) shareholders should be happy to see the share price up 14% in the last month. But that doesn't change the fact that the returns over the last five years have been less than pleasing. In fact, the share price is down 39%, which falls well short of the return you could get by buying an index fund.
Check out our latest analysis for Incitec Pivot
In his essay The Superinvestors of Graham-and-Doddsville Warren Buffett described how share prices do not always rationally reflect the value of a business. One flawed but reasonable way to assess how sentiment around a company has changed is to compare the earnings per share (EPS) with the share price.
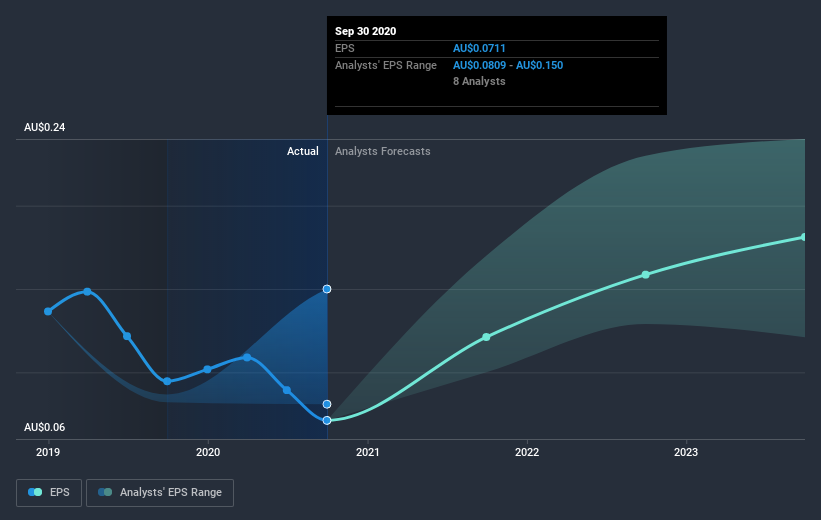
Looking back five years, both Incitec Pivot's share price and EPS declined; the latter at a rate of 21% per year. This fall in the EPS is worse than the 10% compound annual share price fall. The relatively muted share price reaction might be because the market expects the business to turn around.
The company's earnings per share (over time) is depicted in the image below (click to see the exact numbers).
We consider it positive that insiders have made significant purchases in the last year. Even so, future earnings will be far more important to whether current shareholders make money. Before buying or selling a stock, we always recommend a close examination of historic growth trends, available here..
What about the Total Shareholder Return (TSR)?
Investors should note that there's a difference between Incitec Pivot's total shareholder return (TSR) and its share price change, which we've covered above. The TSR attempts to capture the value of dividends (as if they were reinvested) as well as any spin-offs or discounted capital raisings offered to shareholders. Incitec Pivot's TSR of was a loss of 33% for the 5 years. That wasn't as bad as its share price return, because it has paid dividends.
A Different Perspective
Investors in Incitec Pivot had a tough year, with a total loss of 24%, against a market gain of about 5.2%. Even the share prices of good stocks drop sometimes, but we want to see improvements in the fundamental metrics of a business, before getting too interested. Unfortunately, last year's performance may indicate unresolved challenges, given that it was worse than the annualised loss of 6% over the last half decade. Generally speaking long term share price weakness can be a bad sign, though contrarian investors might want to research the stock in hope of a turnaround. It's always interesting to track share price performance over the longer term. But to understand Incitec Pivot better, we need to consider many other factors. Take risks, for example - Incitec Pivot has 2 warning signs we think you should be aware of.
Incitec Pivot is not the only stock that insiders are buying. For those who like to find winning investments this free list of growing companies with recent insider purchasing, could be just the ticket.
Please note, the market returns quoted in this article reflect the market weighted average returns of stocks that currently trade on AU exchanges.
This article by Simply Wall St is general in nature. It does not constitute a recommendation to buy or sell any stock, and does not take account of your objectives, or your financial situation. We aim to bring you long-term focused analysis driven by fundamental data. Note that our analysis may not factor in the latest price-sensitive company announcements or qualitative material. Simply Wall St has no position in any stocks mentioned.
Have feedback on this article? Concerned about the content? Get in touch with us directly. Alternatively, email editorial-team@simplywallst.com.
