
 Yahoo Finance
 Tribune Resources (ASX:TBR) Has Some Difficulty Using Its Capital Effectively
To avoid investing in a business that's in decline, there's a few financial metrics that can provide early indications of aging. Businesses in decline often have two underlying trends, firstly, a declining return on capital employed (ROCE) and a declining base of capital employed. This combination can tell you that not only is the company investing less, it's earning less on what it does invest. And from a first read, things don't look too good at Tribune Resources (ASX:TBR), so let's see why.
Understanding Return On Capital Employed (ROCE)
For those that aren't sure what ROCE is, it measures the amount of pre-tax profits a company can generate from the capital employed in its business. Analysts use this formula to calculate it for Tribune Resources:
Return on Capital Employed = Earnings Before Interest and Tax (EBIT) ÷ (Total Assets - Current Liabilities)
0.031 = AU$9.4m ÷ (AU$306m - AU$7.8m) (Based on the trailing twelve months to June 2023).
So, Tribune Resources has an ROCE of 3.1%. Ultimately, that's a low return and it under-performs the Metals and Mining industry average of 8.9%.
View our latest analysis for Tribune Resources
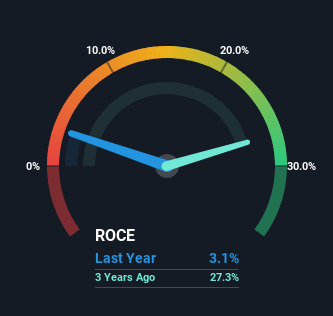
Historical performance is a great place to start when researching a stock so above you can see the gauge for Tribune Resources' ROCE against it's prior returns. If you want to delve into the historical earnings, revenue and cash flow of Tribune Resources, check out these free graphs here.
How Are Returns Trending?
In terms of Tribune Resources' historical ROCE movements, the trend doesn't inspire confidence. To be more specific, the ROCE was 27% five years ago, but since then it has dropped noticeably. And on the capital employed front, the business is utilizing roughly the same amount of capital as it was back then. This combination can be indicative of a mature business that still has areas to deploy capital, but the returns received aren't as high due potentially to new competition or smaller margins. So because these trends aren't typically conducive to creating a multi-bagger, we wouldn't hold our breath on Tribune Resources becoming one if things continue as they have.
Our Take On Tribune Resources' ROCE
All in all, the lower returns from the same amount of capital employed aren't exactly signs of a compounding machine. And, the stock has remained flat over the last five years, so investors don't seem too impressed either. Unless there is a shift to a more positive trajectory in these metrics, we would look elsewhere.
Tribune Resources does have some risks, we noticed 3 warning signs (and 1 which makes us a bit uncomfortable) we think you should know about.
While Tribune Resources isn't earning the highest return, check out this free list of companies that are earning high returns on equity with solid balance sheets.
Have feedback on this article? Concerned about the content? Get in touch with us directly. Alternatively, email editorial-team (at) simplywallst.com.
This article by Simply Wall St is general in nature. We provide commentary based on historical data and analyst forecasts only using an unbiased methodology and our articles are not intended to be financial advice. It does not constitute a recommendation to buy or sell any stock, and does not take account of your objectives, or your financial situation. We aim to bring you long-term focused analysis driven by fundamental data. Note that our analysis may not factor in the latest price-sensitive company announcements or qualitative material. Simply Wall St has no position in any stocks mentioned.
