
 Yahoo Finance
 The total return for Trade Desk (NASDAQ:TTD) investors has risen faster than earnings growth over the last five years
The Trade Desk, Inc. (NASDAQ:TTD) shareholders might be concerned after seeing the share price drop 12% in the last month. But that doesn't change the fact that shareholders have received really good returns over the last five years. We think most investors would be happy with the 298% return, over that period. Generally speaking the long term returns will give you a better idea of business quality than short periods can. Only time will tell if there is still too much optimism currently reflected in the share price.
While this past week has detracted from the company's five-year return, let's look at the recent trends of the underlying business and see if the gains have been in alignment.
See our latest analysis for Trade Desk
While markets are a powerful pricing mechanism, share prices reflect investor sentiment, not just underlying business performance. One flawed but reasonable way to assess how sentiment around a company has changed is to compare the earnings per share (EPS) with the share price.
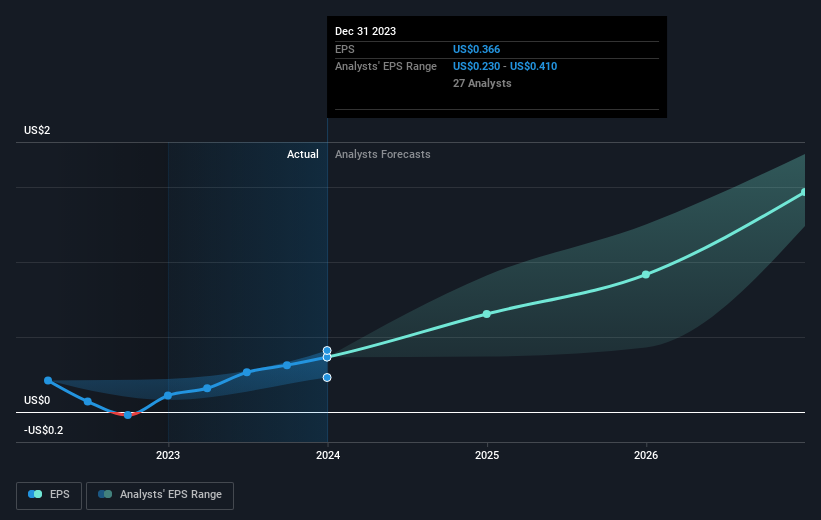
Over half a decade, Trade Desk managed to grow its earnings per share at 12% a year. This EPS growth is lower than the 32% average annual increase in the share price. So it's fair to assume the market has a higher opinion of the business than it did five years ago. That's not necessarily surprising considering the five-year track record of earnings growth. This optimism is visible in its fairly high P/E ratio of 214.08.
You can see below how EPS has changed over time (discover the exact values by clicking on the image).
It's probably worth noting that the CEO is paid less than the median at similar sized companies. But while CEO remuneration is always worth checking, the really important question is whether the company can grow earnings going forward. Dive deeper into the earnings by checking this interactive graph of Trade Desk's earnings, revenue and cash flow.
A Different Perspective
It's nice to see that Trade Desk shareholders have received a total shareholder return of 38% over the last year. That's better than the annualised return of 32% over half a decade, implying that the company is doing better recently. In the best case scenario, this may hint at some real business momentum, implying that now could be a great time to delve deeper. If you would like to research Trade Desk in more detail then you might want to take a look at whether insiders have been buying or selling shares in the company.
But note: Trade Desk may not be the best stock to buy. So take a peek at this free list of interesting companies with past earnings growth (and further growth forecast).
Please note, the market returns quoted in this article reflect the market weighted average returns of stocks that currently trade on American exchanges.
Have feedback on this article? Concerned about the content? Get in touch with us directly. Alternatively, email editorial-team (at) simplywallst.com.
This article by Simply Wall St is general in nature. We provide commentary based on historical data and analyst forecasts only using an unbiased methodology and our articles are not intended to be financial advice. It does not constitute a recommendation to buy or sell any stock, and does not take account of your objectives, or your financial situation. We aim to bring you long-term focused analysis driven by fundamental data. Note that our analysis may not factor in the latest price-sensitive company announcements or qualitative material. Simply Wall St has no position in any stocks mentioned.
