
 Yahoo Finance
 Is It Time To Buy Freedom Insurance Group Ltd (ASX:FIG) Based Off Its PE Ratio?

I am writing today to help inform people who are new to the stock market and want to better understand how you can grow your money by investing in Freedom Insurance Group Ltd (ASX:FIG).
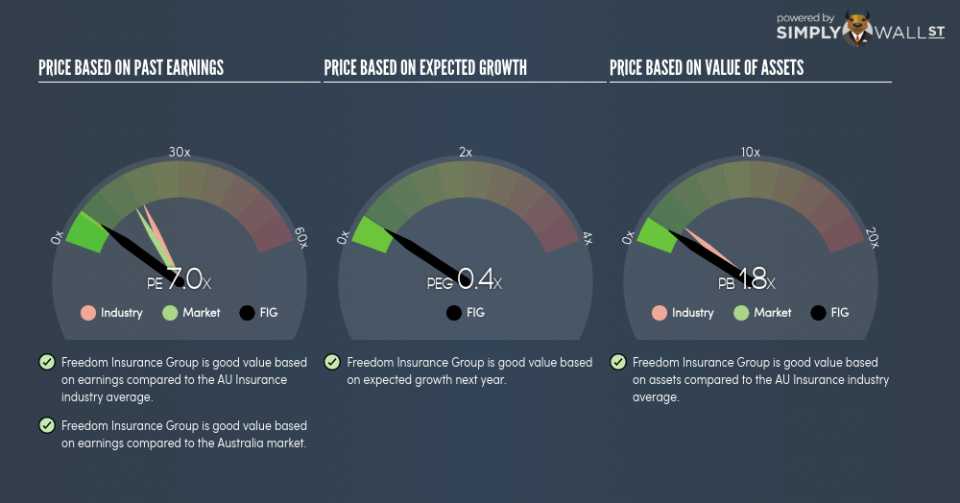
Freedom Insurance Group Ltd (ASX:FIG) trades with a trailing P/E of 7x, which is lower than the industry average of 19.4x. Although some investors may jump to the conclusion that this is a great buying opportunity, understanding the assumptions behind the P/E ratio might change your mind. In this article, I will explain what the P/E ratio is as well as what you should look out for when using it. See our latest analysis for Freedom Insurance Group
Demystifying the P/E ratio
A common ratio used for relative valuation is the P/E ratio. By comparing a stock’s price per share to its earnings per share, we are able to see how much investors are paying for each dollar of the company’s earnings.
P/E Calculation for FIG
Price-Earnings Ratio = Price per share ÷ Earnings per share
FIG Price-Earnings Ratio = A$0.46 ÷ A$0.0654 = 7x
The P/E ratio itself doesn’t tell you a lot; however, it becomes very insightful when you compare it with other similar companies. Our goal is to compare the stock’s P/E ratio to the average of companies that have similar attributes to FIG, such as company lifetime and products sold. A quick method of creating a peer group is to use companies in the same industry, which is what I will do. At 7x, FIG’s P/E is lower than its industry peers (19.4x). This implies that investors are undervaluing each dollar of FIG’s earnings. As such, our analysis shows that FIG represents an under-priced stock.
Assumptions to be aware of
Before you jump to the conclusion that FIG is the perfect buying opportunity, it is important to realise that our conclusion rests on two assertions. The first is that our “similar companies” are actually similar to FIG, or else the difference in P/E might be a result of other factors. For example, if you compared lower risk firms with FIG, then investors would naturally value it at a lower price since it is a riskier investment. The second assumption that must hold true is that the stocks we are comparing FIG to are fairly valued by the market. If this does not hold true, FIG’s lower P/E ratio may be because firms in our peer group are overvalued by the market.
What this means for you:
You may have already conducted fundamental analysis on the stock as a shareholder, so its current undervaluation could signal a good buying opportunity to increase your exposure to FIG. Now that you understand the ins and outs of the PE metric, you should know to bear in mind its limitations before you make an investment decision. Remember that basing your investment decision off one metric alone is certainly not sufficient. There are many things I have not taken into account in this article and the PE ratio is very one-dimensional. If you have not done so already, I urge you to complete your research by taking a look at the following:
Future Outlook: What are well-informed industry analysts predicting for FIG’s future growth? Take a look at our free research report of analyst consensus for FIG’s outlook.
Financial Health: Is FIG’s operations financially sustainable? Balance sheets can be hard to analyze, which is why we’ve done it for you. Check out our financial health checks here.
Other High-Performing Stocks: Are there other stocks that provide better prospects with proven track records? Explore our free list of these great stocks here.
To help readers see pass the short term volatility of the financial market, we aim to bring you a long-term focused research analysis purely driven by fundamental data. Note that our analysis does not factor in the latest price sensitive company announcements.
The author is an independent contributor and at the time of publication had no position in the stocks mentioned.
