
 Yahoo Finance
 The three-year shareholder returns and company earnings persist lower as Downer EDI (ASX:DOW) stock falls a further 3.1% in past week
As an investor its worth striving to ensure your overall portfolio beats the market average. But its virtually certain that sometimes you will buy stocks that fall short of the market average returns. Unfortunately, that's been the case for longer term Downer EDI Limited (ASX:DOW) shareholders, since the share price is down 29% in the last three years, falling well short of the market decline of around 11%. Unfortunately the share price momentum is still quite negative, with prices down 13% in thirty days. However, we note the price may have been impacted by the broader market, which is down 12% in the same time period.
With the stock having lost 3.1% in the past week, it's worth taking a look at business performance and seeing if there's any red flags.
View our latest analysis for Downer EDI
To quote Buffett, 'Ships will sail around the world but the Flat Earth Society will flourish. There will continue to be wide discrepancies between price and value in the marketplace...' By comparing earnings per share (EPS) and share price changes over time, we can get a feel for how investor attitudes to a company have morphed over time.
Downer EDI became profitable within the last five years. That would generally be considered a positive, so we are surprised to see the share price is down. So given the share price is down it's worth checking some other metrics too.
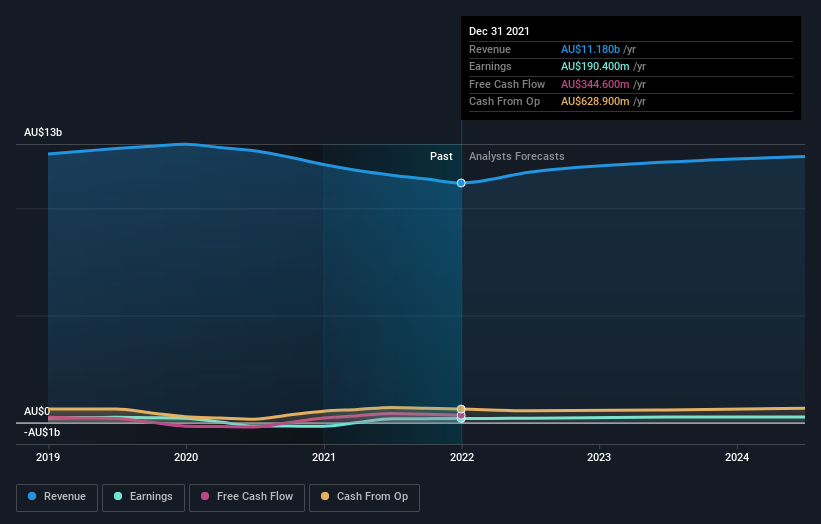
We note that the dividend has declined - a likely contributor to the share price drop. The revenue decline, at an annual rate of 4.5% over three years, might be considered salt in the wound.
The graphic below depicts how earnings and revenue have changed over time (unveil the exact values by clicking on the image).
We know that Downer EDI has improved its bottom line lately, but what does the future have in store? If you are thinking of buying or selling Downer EDI stock, you should check out this free report showing analyst profit forecasts.
What About Dividends?
As well as measuring the share price return, investors should also consider the total shareholder return (TSR). The TSR is a return calculation that accounts for the value of cash dividends (assuming that any dividend received was reinvested) and the calculated value of any discounted capital raisings and spin-offs. It's fair to say that the TSR gives a more complete picture for stocks that pay a dividend. In the case of Downer EDI, it has a TSR of -20% for the last 3 years. That exceeds its share price return that we previously mentioned. And there's no prize for guessing that the dividend payments largely explain the divergence!
A Different Perspective
Downer EDI shareholders are down 9.6% over twelve months (even including dividends), which isn't far from the market return of -8.7%. So last year was actually even worse than the last five years, which cost shareholders 0.8% per year. Weak performance over the long term usually destroys market confidence in a stock, but bargain hunters may want to take a closer look for signs of a turnaround. It's always interesting to track share price performance over the longer term. But to understand Downer EDI better, we need to consider many other factors. Even so, be aware that Downer EDI is showing 2 warning signs in our investment analysis , you should know about...
For those who like to find winning investments this free list of growing companies with recent insider purchasing, could be just the ticket.
Please note, the market returns quoted in this article reflect the market weighted average returns of stocks that currently trade on AU exchanges.
Have feedback on this article? Concerned about the content? Get in touch with us directly. Alternatively, email editorial-team (at) simplywallst.com.
This article by Simply Wall St is general in nature. We provide commentary based on historical data and analyst forecasts only using an unbiased methodology and our articles are not intended to be financial advice. It does not constitute a recommendation to buy or sell any stock, and does not take account of your objectives, or your financial situation. We aim to bring you long-term focused analysis driven by fundamental data. Note that our analysis may not factor in the latest price-sensitive company announcements or qualitative material. Simply Wall St has no position in any stocks mentioned.
