
 Yahoo Finance
 Those Who Purchased Wameja (ASX:WJA) Shares Five Years Ago Have A 74% Loss To Show For It

Over the last month the Wameja Limited (ASX:WJA) has been much stronger than before, rebounding by 55%. But spare a thought for the long term holders, who have held the stock as it bled value over the last five years. Like a ship taking on water, the share price has sunk 74% in that time. The recent bounce might mean the long decline is over, but we are not confident. The fundamental business performance will ultimately determine if the turnaround can be sustained.
Check out our latest analysis for Wameja
Wameja isn't currently profitable, so most analysts would look to revenue growth to get an idea of how fast the underlying business is growing. When a company doesn't make profits, we'd generally expect to see good revenue growth. Some companies are willing to postpone profitability to grow revenue faster, but in that case one does expect good top-line growth.
Over half a decade Wameja reduced its trailing twelve month revenue by 21% for each year. That puts it in an unattractive cohort, to put it mildly. So it's not altogether surprising to see the share price down 24% per year in the same time period. This kind of price performance makes us very wary, especially when combined with falling revenue. Ironically, that behavior could create an opportunity for the contrarian investor - but only if there are good reasons to predict a brighter future.
The graphic below depicts how earnings and revenue have changed over time (unveil the exact values by clicking on the image).
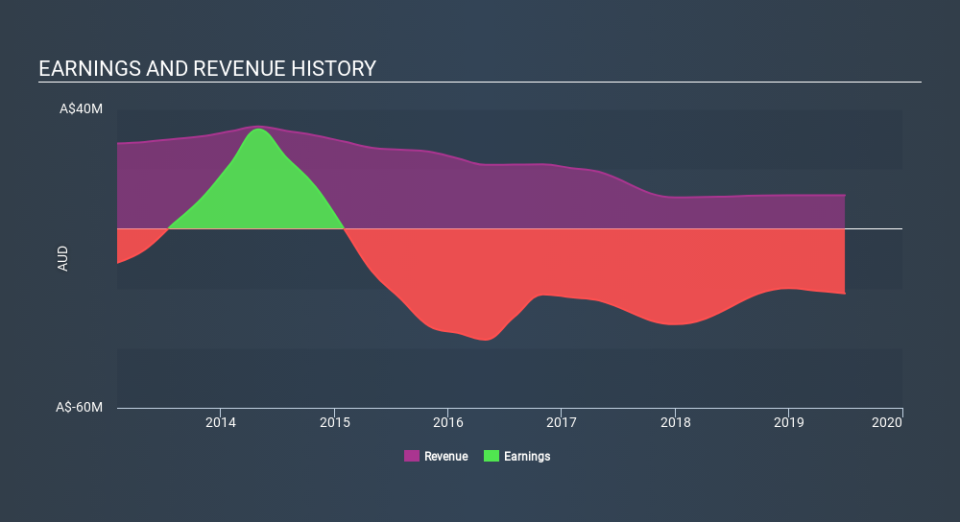
You can see how its balance sheet has strengthened (or weakened) over time in this free interactive graphic.
What about the Total Shareholder Return (TSR)?
Investors should note that there's a difference between Wameja's total shareholder return (TSR) and its share price change, which we've covered above. The TSR is a return calculation that accounts for the value of cash dividends (assuming that any dividend received was reinvested) and the calculated value of any discounted capital raisings and spin-offs. Wameja's TSR of was a loss of 71% for the 5 years. That wasn't as bad as its share price return, because it has paid dividends.
A Different Perspective
Wameja shareholders are up 13% for the year. But that was short of the market average. On the bright side, that's still a gain, and it is certainly better than the yearly loss of about 22% endured over half a decade. So this might be a sign the business has turned its fortunes around. While it is well worth considering the different impacts that market conditions can have on the share price, there are other factors that are even more important. Case in point: We've spotted 4 warning signs for Wameja you should be aware of, and 1 of them is a bit concerning.
If you like to buy stocks alongside management, then you might just love this free list of companies. (Hint: insiders have been buying them).
Please note, the market returns quoted in this article reflect the market weighted average returns of stocks that currently trade on AU exchanges.
If you spot an error that warrants correction, please contact the editor at editorial-team@simplywallst.com. This article by Simply Wall St is general in nature. It does not constitute a recommendation to buy or sell any stock, and does not take account of your objectives, or your financial situation. Simply Wall St has no position in the stocks mentioned.
We aim to bring you long-term focused research analysis driven by fundamental data. Note that our analysis may not factor in the latest price-sensitive company announcements or qualitative material. Thank you for reading.
