
 Yahoo Finance
 Those who invested in Somero Enterprises (LON:SOM) three years ago are up 147%
By buying an index fund, investors can approximate the average market return. But if you pick the right individual stocks, you could make more than that. Just take a look at Somero Enterprises, Inc. (LON:SOM), which is up 95%, over three years, soundly beating the market decline of 11% (not including dividends).
So let's assess the underlying fundamentals over the last 3 years and see if they've moved in lock-step with shareholder returns.
View our latest analysis for Somero Enterprises
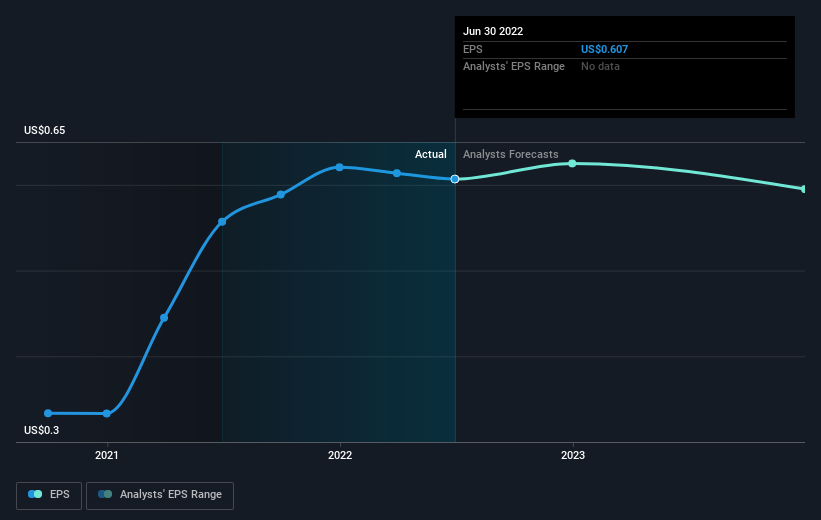
In his essay The Superinvestors of Graham-and-Doddsville Warren Buffett described how share prices do not always rationally reflect the value of a business. By comparing earnings per share (EPS) and share price changes over time, we can get a feel for how investor attitudes to a company have morphed over time.
Somero Enterprises was able to grow its EPS at 22% per year over three years, sending the share price higher. We don't think it is entirely coincidental that the EPS growth is reasonably close to the 25% average annual increase in the share price. That suggests that the market sentiment around the company hasn't changed much over that time. Quite to the contrary, the share price has arguably reflected the EPS growth.
The image below shows how EPS has tracked over time (if you click on the image you can see greater detail).
Before buying or selling a stock, we always recommend a close examination of historic growth trends, available here.
What About Dividends?
As well as measuring the share price return, investors should also consider the total shareholder return (TSR). The TSR incorporates the value of any spin-offs or discounted capital raisings, along with any dividends, based on the assumption that the dividends are reinvested. Arguably, the TSR gives a more comprehensive picture of the return generated by a stock. In the case of Somero Enterprises, it has a TSR of 147% for the last 3 years. That exceeds its share price return that we previously mentioned. This is largely a result of its dividend payments!
A Different Perspective
The total return of 14% received by Somero Enterprises shareholders over the last year isn't far from the market return of -14%. Longer term investors wouldn't be so upset, since they would have made 14%, each year, over five years. If the stock price has been impacted by changing sentiment, rather than deteriorating business conditions, it could spell opportunity. It's always interesting to track share price performance over the longer term. But to understand Somero Enterprises better, we need to consider many other factors. Like risks, for instance. Every company has them, and we've spotted 3 warning signs for Somero Enterprises (of which 2 are concerning!) you should know about.
Of course Somero Enterprises may not be the best stock to buy. So you may wish to see this free collection of growth stocks.
Please note, the market returns quoted in this article reflect the market weighted average returns of stocks that currently trade on GB exchanges.
Have feedback on this article? Concerned about the content? Get in touch with us directly. Alternatively, email editorial-team (at) simplywallst.com.
This article by Simply Wall St is general in nature. We provide commentary based on historical data and analyst forecasts only using an unbiased methodology and our articles are not intended to be financial advice. It does not constitute a recommendation to buy or sell any stock, and does not take account of your objectives, or your financial situation. We aim to bring you long-term focused analysis driven by fundamental data. Note that our analysis may not factor in the latest price-sensitive company announcements or qualitative material. Simply Wall St has no position in any stocks mentioned.
Join A Paid User Research Session
You’ll receive a US$30 Amazon Gift card for 1 hour of your time while helping us build better investing tools for the individual investors like yourself. Sign up here
