
 Yahoo Finance
 Those who invested in Mainfreight (NZSE:MFT) five years ago are up 113%
When we invest, we're generally looking for stocks that outperform the market average. Buying under-rated businesses is one path to excess returns. To wit, the Mainfreight share price has climbed 92% in five years, easily topping the market decline of 1.9% (ignoring dividends). On the other hand, the more recent gains haven't been so impressive, with shareholders gaining just 1.9% , including dividends .
Now it's worth having a look at the company's fundamentals too, because that will help us determine if the long term shareholder return has matched the performance of the underlying business.
See our latest analysis for Mainfreight
There is no denying that markets are sometimes efficient, but prices do not always reflect underlying business performance. One imperfect but simple way to consider how the market perception of a company has shifted is to compare the change in the earnings per share (EPS) with the share price movement.
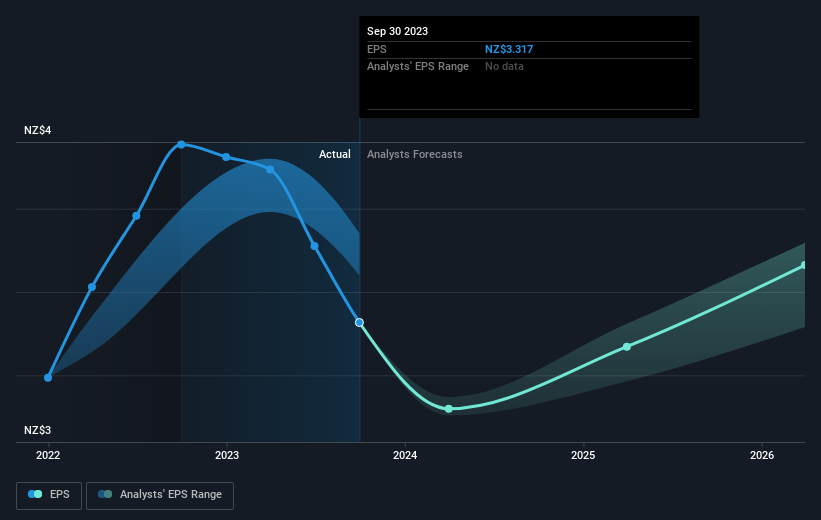
Over half a decade, Mainfreight managed to grow its earnings per share at 22% a year. This EPS growth is higher than the 14% average annual increase in the share price. So it seems the market isn't so enthusiastic about the stock these days.
The image below shows how EPS has tracked over time (if you click on the image you can see greater detail).
We consider it positive that insiders have made significant purchases in the last year. Even so, future earnings will be far more important to whether current shareholders make money. Before buying or selling a stock, we always recommend a close examination of historic growth trends, available here..
What About Dividends?
As well as measuring the share price return, investors should also consider the total shareholder return (TSR). Whereas the share price return only reflects the change in the share price, the TSR includes the value of dividends (assuming they were reinvested) and the benefit of any discounted capital raising or spin-off. Arguably, the TSR gives a more comprehensive picture of the return generated by a stock. As it happens, Mainfreight's TSR for the last 5 years was 113%, which exceeds the share price return mentioned earlier. This is largely a result of its dividend payments!
A Different Perspective
Mainfreight shareholders gained a total return of 1.9% during the year. But that return falls short of the market. On the bright side, the longer term returns (running at about 16% a year, over half a decade) look better. It's quite possible the business continues to execute with prowess, even as the share price gains are slowing. It is all well and good that insiders have been buying shares, but we suggest you check here to see what price insiders were buying at.
Mainfreight is not the only stock insiders are buying. So take a peek at this free list of growing companies with insider buying.
Please note, the market returns quoted in this article reflect the market weighted average returns of stocks that currently trade on New Zealander exchanges.
Have feedback on this article? Concerned about the content? Get in touch with us directly. Alternatively, email editorial-team (at) simplywallst.com.
This article by Simply Wall St is general in nature. We provide commentary based on historical data and analyst forecasts only using an unbiased methodology and our articles are not intended to be financial advice. It does not constitute a recommendation to buy or sell any stock, and does not take account of your objectives, or your financial situation. We aim to bring you long-term focused analysis driven by fundamental data. Note that our analysis may not factor in the latest price-sensitive company announcements or qualitative material. Simply Wall St has no position in any stocks mentioned.
