
 Yahoo Finance
 Those who invested in Joyce (ASX:JYC) three years ago are up 99%
By buying an index fund, you can roughly match the market return with ease. But if you buy good businesses at attractive prices, your portfolio returns could exceed the average market return. For example, Joyce Corporation Ltd (ASX:JYC) shareholders have seen the share price rise 99% over three years, well in excess of the market return (12%, not including dividends).
So let's investigate and see if the longer term performance of the company has been in line with the underlying business' progress.
Check out our latest analysis for Joyce
To paraphrase Benjamin Graham: Over the short term the market is a voting machine, but over the long term it's a weighing machine. One way to examine how market sentiment has changed over time is to look at the interaction between a company's share price and its earnings per share (EPS).
During three years of share price growth, Joyce moved from a loss to profitability. So we would expect a higher share price over the period.
The company's earnings per share (over time) is depicted in the image below (click to see the exact numbers).
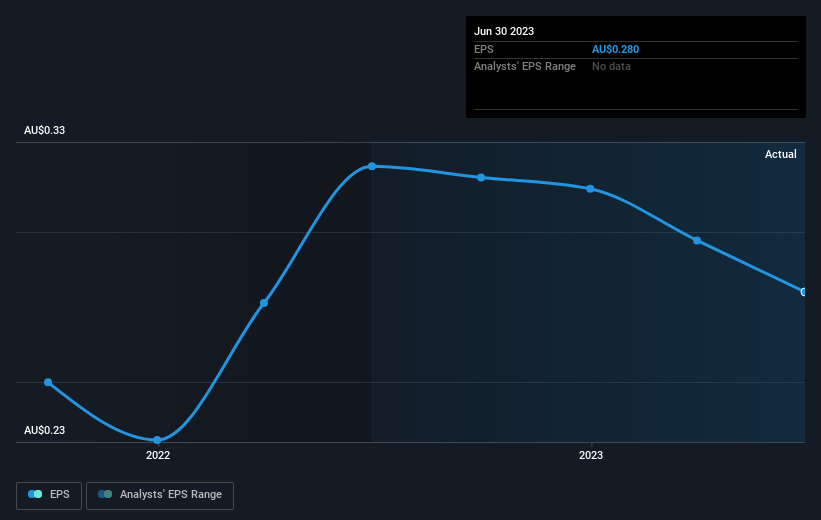
Dive deeper into Joyce's key metrics by checking this interactive graph of Joyce's earnings, revenue and cash flow.
A Different Perspective
Investors in Joyce had a tough year, with a total loss of 18% (including dividends), against a market gain of about 4.5%. However, keep in mind that even the best stocks will sometimes underperform the market over a twelve month period. On the bright side, long term shareholders have made money, with a gain of 13% per year over half a decade. If the fundamental data continues to indicate long term sustainable growth, the current sell-off could be an opportunity worth considering. I find it very interesting to look at share price over the long term as a proxy for business performance. But to truly gain insight, we need to consider other information, too. Take risks, for example - Joyce has 2 warning signs we think you should be aware of.
For those who like to find winning investments this free list of growing companies with recent insider purchasing, could be just the ticket.
Please note, the market returns quoted in this article reflect the market weighted average returns of stocks that currently trade on Australian exchanges.
Have feedback on this article? Concerned about the content? Get in touch with us directly. Alternatively, email editorial-team (at) simplywallst.com.
This article by Simply Wall St is general in nature. We provide commentary based on historical data and analyst forecasts only using an unbiased methodology and our articles are not intended to be financial advice. It does not constitute a recommendation to buy or sell any stock, and does not take account of your objectives, or your financial situation. We aim to bring you long-term focused analysis driven by fundamental data. Note that our analysis may not factor in the latest price-sensitive company announcements or qualitative material. Simply Wall St has no position in any stocks mentioned.
