
 Yahoo Finance
 Those who invested in Diversified United Investment (ASX:DUI) five years ago are up 56%
Passive investing in index funds can generate returns that roughly match the overall market. But you can do a lot better than that by buying good quality businesses for attractive prices. For example, the Diversified United Investment Limited (ASX:DUI) share price is 31% higher than it was five years ago, which is more than the market average. Also positive is the 5.7% share price rise over the last year.
Let's take a look at the underlying fundamentals over the longer term, and see if they've been consistent with shareholders returns.
View our latest analysis for Diversified United Investment
To paraphrase Benjamin Graham: Over the short term the market is a voting machine, but over the long term it's a weighing machine. One way to examine how market sentiment has changed over time is to look at the interaction between a company's share price and its earnings per share (EPS).
Over half a decade, Diversified United Investment managed to grow its earnings per share at 3.4% a year. This EPS growth is lower than the 6% average annual increase in the share price. So it's fair to assume the market has a higher opinion of the business than it did five years ago. And that's hardly shocking given the track record of growth.
The company's earnings per share (over time) is depicted in the image below (click to see the exact numbers).
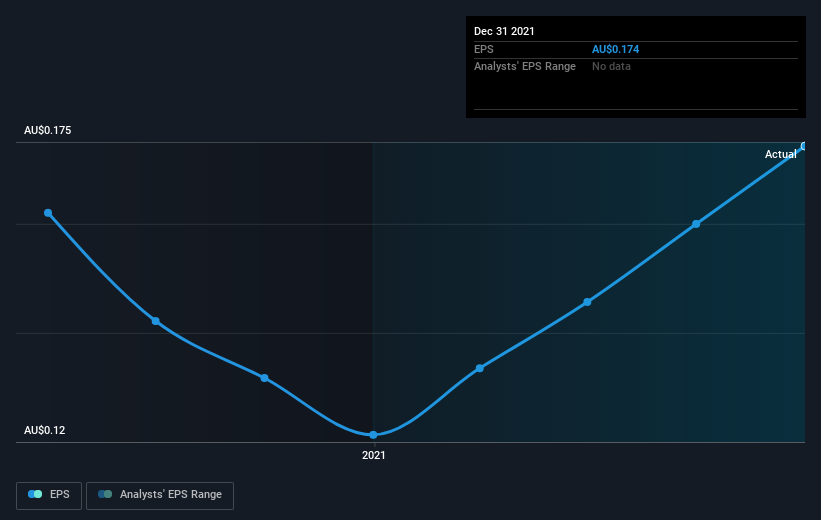
This free interactive report on Diversified United Investment's earnings, revenue and cash flow is a great place to start, if you want to investigate the stock further.
What About Dividends?
It is important to consider the total shareholder return, as well as the share price return, for any given stock. The TSR is a return calculation that accounts for the value of cash dividends (assuming that any dividend received was reinvested) and the calculated value of any discounted capital raisings and spin-offs. So for companies that pay a generous dividend, the TSR is often a lot higher than the share price return. As it happens, Diversified United Investment's TSR for the last 5 years was 56%, which exceeds the share price return mentioned earlier. This is largely a result of its dividend payments!
A Different Perspective
Diversified United Investment shareholders have received returns of 8.9% over twelve months (even including dividends), which isn't far from the general market return. We should note here that the five-year TSR is more impressive, at 9% per year. Although the share price growth has slowed, the longer term story points to a business well worth watching. While it is well worth considering the different impacts that market conditions can have on the share price, there are other factors that are even more important. For example, we've discovered 1 warning sign for Diversified United Investment that you should be aware of before investing here.
If you are like me, then you will not want to miss this free list of growing companies that insiders are buying.
Please note, the market returns quoted in this article reflect the market weighted average returns of stocks that currently trade on AU exchanges.
Have feedback on this article? Concerned about the content? Get in touch with us directly. Alternatively, email editorial-team (at) simplywallst.com.
This article by Simply Wall St is general in nature. We provide commentary based on historical data and analyst forecasts only using an unbiased methodology and our articles are not intended to be financial advice. It does not constitute a recommendation to buy or sell any stock, and does not take account of your objectives, or your financial situation. We aim to bring you long-term focused analysis driven by fundamental data. Note that our analysis may not factor in the latest price-sensitive company announcements or qualitative material. Simply Wall St has no position in any stocks mentioned.
