
 Yahoo Finance
 Those who invested in Brenntag (ETR:BNR) five years ago are up 76%
Generally speaking the aim of active stock picking is to find companies that provide returns that are superior to the market average. Buying under-rated businesses is one path to excess returns. For example, the Brenntag SE (ETR:BNR) share price is up 56% in the last 5 years, clearly besting the market decline of around 2.5% (ignoring dividends). However, more recent returns haven't been as impressive as that, with the stock returning just 1.5% in the last year , including dividends .
So let's assess the underlying fundamentals over the last 5 years and see if they've moved in lock-step with shareholder returns.
See our latest analysis for Brenntag
In his essay The Superinvestors of Graham-and-Doddsville Warren Buffett described how share prices do not always rationally reflect the value of a business. By comparing earnings per share (EPS) and share price changes over time, we can get a feel for how investor attitudes to a company have morphed over time.
During five years of share price growth, Brenntag achieved compound earnings per share (EPS) growth of 11% per year. So the EPS growth rate is rather close to the annualized share price gain of 9% per year. This indicates that investor sentiment towards the company has not changed a great deal. Indeed, it would appear the share price is reacting to the EPS.
The graphic below depicts how EPS has changed over time (unveil the exact values by clicking on the image).
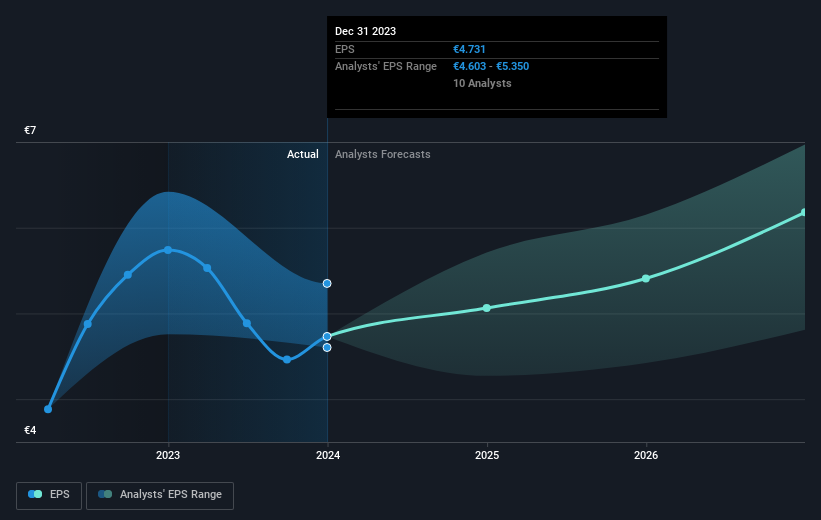
This free interactive report on Brenntag's earnings, revenue and cash flow is a great place to start, if you want to investigate the stock further.
What About Dividends?
When looking at investment returns, it is important to consider the difference between total shareholder return (TSR) and share price return. The TSR is a return calculation that accounts for the value of cash dividends (assuming that any dividend received was reinvested) and the calculated value of any discounted capital raisings and spin-offs. So for companies that pay a generous dividend, the TSR is often a lot higher than the share price return. In the case of Brenntag, it has a TSR of 76% for the last 5 years. That exceeds its share price return that we previously mentioned. The dividends paid by the company have thusly boosted the total shareholder return.
A Different Perspective
Brenntag shareholders gained a total return of 1.5% during the year. But that was short of the market average. On the bright side, the longer term returns (running at about 12% a year, over half a decade) look better. It's quite possible the business continues to execute with prowess, even as the share price gains are slowing. Before deciding if you like the current share price, check how Brenntag scores on these 3 valuation metrics.
Of course, you might find a fantastic investment by looking elsewhere. So take a peek at this free list of companies we expect will grow earnings.
Please note, the market returns quoted in this article reflect the market weighted average returns of stocks that currently trade on German exchanges.
Have feedback on this article? Concerned about the content? Get in touch with us directly. Alternatively, email editorial-team (at) simplywallst.com.
This article by Simply Wall St is general in nature. We provide commentary based on historical data and analyst forecasts only using an unbiased methodology and our articles are not intended to be financial advice. It does not constitute a recommendation to buy or sell any stock, and does not take account of your objectives, or your financial situation. We aim to bring you long-term focused analysis driven by fundamental data. Note that our analysis may not factor in the latest price-sensitive company announcements or qualitative material. Simply Wall St has no position in any stocks mentioned.
