
 Yahoo Finance
 Those who invested in Aurelia Metals (ASX:AMI) five years ago are up 77%
The last three months have been tough on Aurelia Metals Limited (ASX:AMI) shareholders, who have seen the share price decline a rather worrying 31%. On the bright side the returns have been quite good over the last half decade. Its return of 66% has certainly bested the market return!
So let's assess the underlying fundamentals over the last 5 years and see if they've moved in lock-step with shareholder returns.
Check out our latest analysis for Aurelia Metals
While markets are a powerful pricing mechanism, share prices reflect investor sentiment, not just underlying business performance. One imperfect but simple way to consider how the market perception of a company has shifted is to compare the change in the earnings per share (EPS) with the share price movement.
Aurelia Metals' earnings per share are down 17% per year, despite strong share price performance over five years.
Essentially, it doesn't seem likely that investors are focused on EPS. Since the change in EPS doesn't seem to correlate with the change in share price, it's worth taking a look at other metrics.
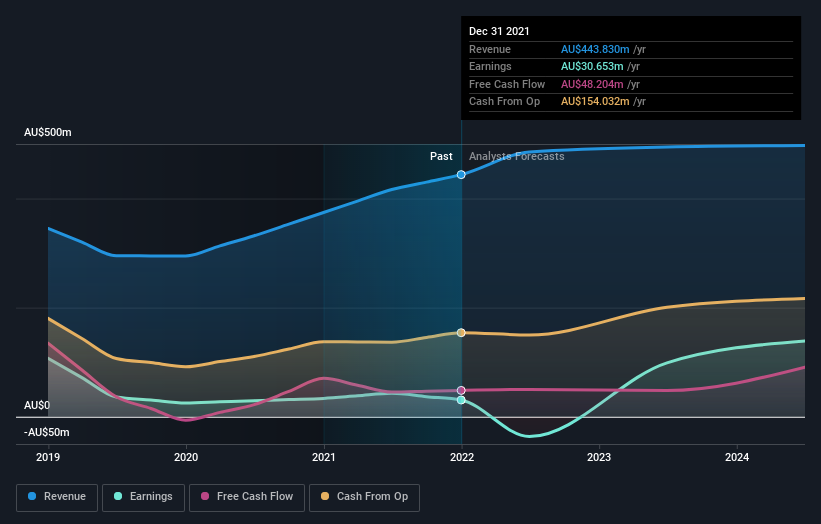
In contrast revenue growth of 24% per year is probably viewed as evidence that Aurelia Metals is growing, a real positive. It's quite possible that management are prioritizing revenue growth over EPS growth at the moment.
The graphic below depicts how earnings and revenue have changed over time (unveil the exact values by clicking on the image).
Balance sheet strength is crucial. It might be well worthwhile taking a look at our free report on how its financial position has changed over time.
What about the Total Shareholder Return (TSR)?
We'd be remiss not to mention the difference between Aurelia Metals' total shareholder return (TSR) and its share price return. The TSR is a return calculation that accounts for the value of cash dividends (assuming that any dividend received was reinvested) and the calculated value of any discounted capital raisings and spin-offs. Dividends have been really beneficial for Aurelia Metals shareholders, and that cash payout contributed to why its TSR of 77%, over the last 5 years, is better than the share price return.
A Different Perspective
While the broader market gained around 1.8% in the last year, Aurelia Metals shareholders lost 23%. Even the share prices of good stocks drop sometimes, but we want to see improvements in the fundamental metrics of a business, before getting too interested. Longer term investors wouldn't be so upset, since they would have made 12%, each year, over five years. It could be that the recent sell-off is an opportunity, so it may be worth checking the fundamental data for signs of a long term growth trend. I find it very interesting to look at share price over the long term as a proxy for business performance. But to truly gain insight, we need to consider other information, too. Take risks, for example - Aurelia Metals has 1 warning sign we think you should be aware of.
If you would prefer to check out another company -- one with potentially superior financials -- then do not miss this free list of companies that have proven they can grow earnings.
Please note, the market returns quoted in this article reflect the market weighted average returns of stocks that currently trade on AU exchanges.
Have feedback on this article? Concerned about the content? Get in touch with us directly. Alternatively, email editorial-team (at) simplywallst.com.
This article by Simply Wall St is general in nature. We provide commentary based on historical data and analyst forecasts only using an unbiased methodology and our articles are not intended to be financial advice. It does not constitute a recommendation to buy or sell any stock, and does not take account of your objectives, or your financial situation. We aim to bring you long-term focused analysis driven by fundamental data. Note that our analysis may not factor in the latest price-sensitive company announcements or qualitative material. Simply Wall St has no position in any stocks mentioned.
