
 Yahoo Finance
 This company makes $3.3 million per employee

Technology businesses have been the darlings of the sharemarket in the past decade, but new research has actually quantified how they are so productive.
UK investment site Buy Shares this month calculated the companies with the top revenue per employee dollar values. That is, how much money does it make for each staff member?
Streaming giant Netflix came in at the top, raking in a stunning $3.28 million dollars per employee for the 2019 financial year.
Apple generated $2.66 million for each staff member, while Facebook came in third with $2.2 million. Google's parent company Alphabet wasn't far behind, making $1.9 million per worker.
Imagine running a business where each person you hire brings in millions of dollars. How do these tech companies do it?
It's because technology is easily scalable – meaning one piece of software costs the same amount to build regardless of whether 10 people are using it or one million.
"Generally, revenue per employee is less in the industries which are labor-intensive but high in tech companies with low labor-intensity like Netflix," said Buy Shares editor Justinas Baltrusaitis.
Amazon, which requires non-scalable manual labour for packing and shipping, was further down the list, making $492,000 per employee.
Covid-19 supercharges existing trends
Industries like entertainment streaming were already hot, but the pandemic has accelerated its growth, according to consultants McKinsey & Company.
"The crisis has accelerated a trend that was already present. Between December 2018 and May 2020, the top quintile of companies grew its total market-implied annual economic profit by US$335 billion, while companies in the bottom quintile lost a staggering US$303 billion," read its report this week.
"And while the specific numbers can fluctuate from day to day, the larger trend is unmistakable: a gap is opening up, and it’s rapidly expanding."
In the previous economic downturn in the late 2000s, once-great industries like energy and finance were toppled as others came to the fore.
But in the 2020 coronavirus recession it's different.
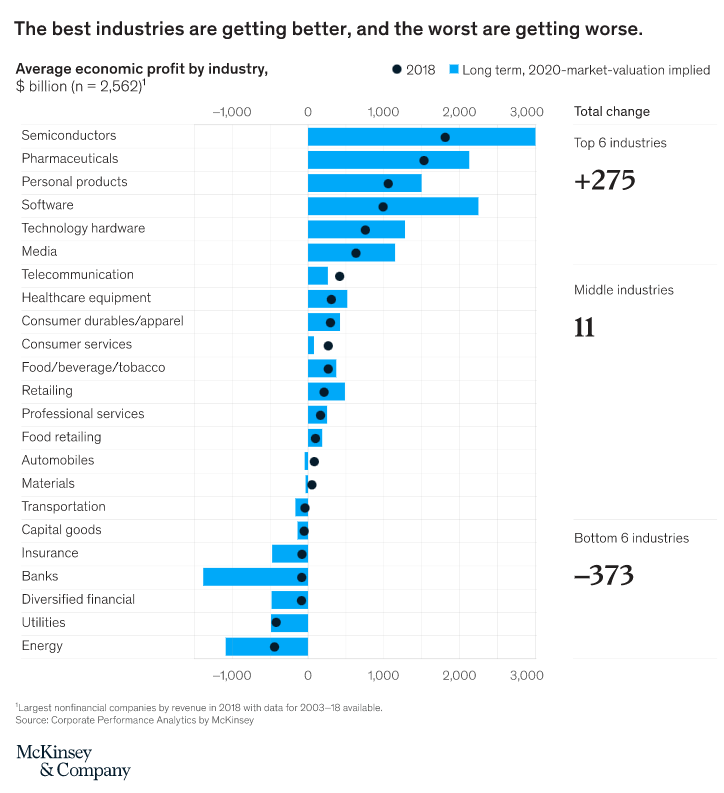
"Industries and companies that started at the top of the curve before this crisis are proving to be resilient, while those that were at the bottom are accruing the biggest losses," McKinsey stated.
"Sectors that were at the top of the curve before the crisis, such as pharmaceuticals and semiconductors, seem to be pulling ahead from the less profitable industries that started at the bottom, such as banks and utilities. In fact, the six most-profitable industries have added US$275 billion a year to their expected economic-profit pool, while the bottom six have lost US$373 billion."
Follow Yahoo Finance Australia on Facebook, Twitter, Instagram and LinkedIn.
Sign up to the newsletter for exclusive access to the Yahoo Finance Breakfast Club.
