
 Yahoo Finance
 We Think Magnolia Oil & Gas (NYSE:MGY) Might Have The DNA Of A Multi-Bagger
To find a multi-bagger stock, what are the underlying trends we should look for in a business? Firstly, we'd want to identify a growing return on capital employed (ROCE) and then alongside that, an ever-increasing base of capital employed. Put simply, these types of businesses are compounding machines, meaning they are continually reinvesting their earnings at ever-higher rates of return. With that in mind, the ROCE of Magnolia Oil & Gas (NYSE:MGY) looks great, so lets see what the trend can tell us.
Understanding Return On Capital Employed (ROCE)
For those who don't know, ROCE is a measure of a company's yearly pre-tax profit (its return), relative to the capital employed in the business. The formula for this calculation on Magnolia Oil & Gas is:
Return on Capital Employed = Earnings Before Interest and Tax (EBIT) ÷ (Total Assets - Current Liabilities)
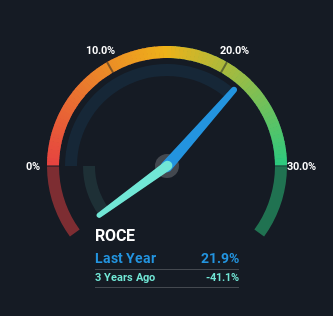
0.22 = US$534m ÷ (US$2.8b - US$315m) (Based on the trailing twelve months to December 2023).
So, Magnolia Oil & Gas has an ROCE of 22%. That's a fantastic return and not only that, it outpaces the average of 15% earned by companies in a similar industry.
View our latest analysis for Magnolia Oil & Gas
Above you can see how the current ROCE for Magnolia Oil & Gas compares to its prior returns on capital, but there's only so much you can tell from the past. If you're interested, you can view the analysts predictions in our free analyst report for Magnolia Oil & Gas .
What Does the ROCE Trend For Magnolia Oil & Gas Tell Us?
You'd find it hard not to be impressed with the ROCE trend at Magnolia Oil & Gas. The data shows that returns on capital have increased by 113% over the trailing five years. The company is now earning US$0.2 per dollar of capital employed. In regards to capital employed, Magnolia Oil & Gas appears to been achieving more with less, since the business is using 25% less capital to run its operation. If this trend continues, the business might be getting more efficient but it's shrinking in terms of total assets.
What We Can Learn From Magnolia Oil & Gas' ROCE
In summary, it's great to see that Magnolia Oil & Gas has been able to turn things around and earn higher returns on lower amounts of capital. Since the stock has returned a staggering 108% to shareholders over the last five years, it looks like investors are recognizing these changes. With that being said, we still think the promising fundamentals mean the company deserves some further due diligence.
One more thing to note, we've identified 2 warning signs with Magnolia Oil & Gas and understanding them should be part of your investment process.
High returns are a key ingredient to strong performance, so check out our free list ofstocks earning high returns on equity with solid balance sheets.
Have feedback on this article? Concerned about the content? Get in touch with us directly. Alternatively, email editorial-team (at) simplywallst.com.
This article by Simply Wall St is general in nature. We provide commentary based on historical data and analyst forecasts only using an unbiased methodology and our articles are not intended to be financial advice. It does not constitute a recommendation to buy or sell any stock, and does not take account of your objectives, or your financial situation. We aim to bring you long-term focused analysis driven by fundamental data. Note that our analysis may not factor in the latest price-sensitive company announcements or qualitative material. Simply Wall St has no position in any stocks mentioned.
