
 Yahoo Finance
 We Think LKQ (NASDAQ:LKQ) Is Taking Some Risk With Its Debt

Warren Buffett famously said, 'Volatility is far from synonymous with risk.' It's only natural to consider a company's balance sheet when you examine how risky it is, since debt is often involved when a business collapses. We note that LKQ Corporation (NASDAQ:LKQ) does have debt on its balance sheet. But is this debt a concern to shareholders?
When Is Debt Dangerous?
Debt is a tool to help businesses grow, but if a business is incapable of paying off its lenders, then it exists at their mercy. If things get really bad, the lenders can take control of the business. However, a more common (but still painful) scenario is that it has to raise new equity capital at a low price, thus permanently diluting shareholders. Of course, debt can be an important tool in businesses, particularly capital heavy businesses. The first thing to do when considering how much debt a business uses is to look at its cash and debt together.
Check out our latest analysis for LKQ
What Is LKQ's Debt?
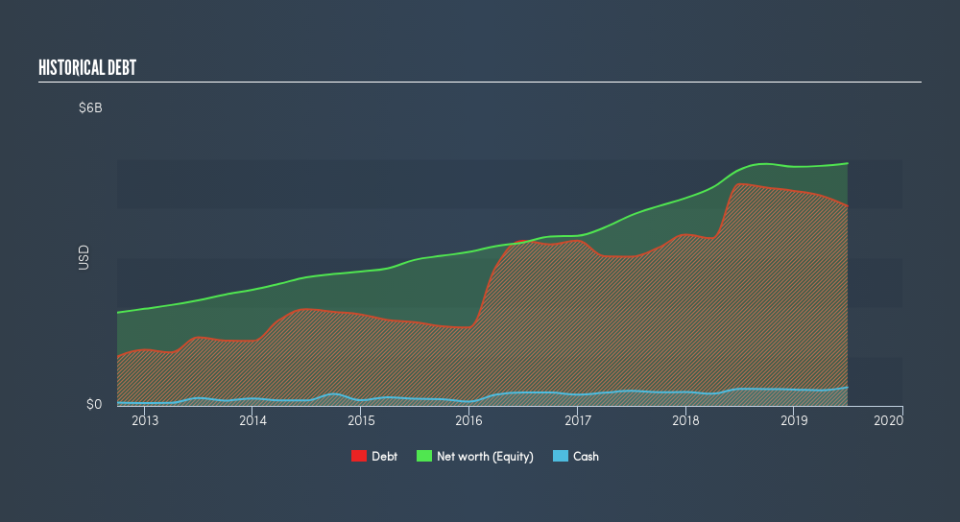
The image below, which you can click on for greater detail, shows that LKQ had debt of US$4.04b at the end of June 2019, a reduction from US$4.49b over a year. However, because it has a cash reserve of US$376.0m, its net debt is less, at about US$3.67b.
How Strong Is LKQ's Balance Sheet?
We can see from the most recent balance sheet that LKQ had liabilities of US$2.11b falling due within a year, and liabilities of US$5.69b due beyond that. On the other hand, it had cash of US$376.0m and US$1.29b worth of receivables due within a year. So its liabilities total US$6.13b more than the combination of its cash and short-term receivables.
This deficit is considerable relative to its market capitalization of US$7.72b, so it does suggest shareholders should keep an eye on LKQ's use of debt. Should its lenders demand that it shore up the balance sheet, shareholders would likely face severe dilution.
In order to size up a company's debt relative to its earnings, we calculate its net debt divided by its earnings before interest, tax, depreciation, and amortization (EBITDA) and its earnings before interest and tax (EBIT) divided by its interest expense (its interest cover). Thus we consider debt relative to earnings both with and without depreciation and amortization expenses.
LKQ has a debt to EBITDA ratio of 2.9 and its EBIT covered its interest expense 6.3 times. This suggests that while the debt levels are significant, we'd stop short of calling them problematic. We saw LKQ grow its EBIT by 8.7% in the last twelve months. Whilst that hardly knocks our socks off it is a positive when it comes to debt. There's no doubt that we learn most about debt from the balance sheet. But ultimately the future profitability of the business will decide if LKQ can strengthen its balance sheet over time. So if you want to see what the professionals think, you might find this free report on analyst profit forecasts to be interesting.
Finally, a business needs free cash flow to pay off debt; accounting profits just don't cut it. So we always check how much of that EBIT is translated into free cash flow. Over the most recent three years, LKQ recorded free cash flow worth 56% of its EBIT, which is around normal, given free cash flow excludes interest and tax. This free cash flow puts the company in a good position to pay down debt, when appropriate.
Our View
While LKQ's net debt to EBITDA makes us cautious about it, its track record of staying on top of its total liabilities is no better. At least its conversion of EBIT to free cash flow gives us reason to be optimistic. We think that LKQ's debt does make it a bit risky, after considering the aforementioned data points together. Not all risk is bad, as it can boost share price returns if it pays off, but this debt risk is worth keeping in mind. Above most other metrics, we think its important to track how fast earnings per share is growing, if at all. If you've also come to that realization, you're in luck, because today you can view this interactive graph of LKQ's earnings per share history for free.
If you're interested in investing in businesses that can grow profits without the burden of debt, then check out this free list of growing businesses that have net cash on the balance sheet.
We aim to bring you long-term focused research analysis driven by fundamental data. Note that our analysis may not factor in the latest price-sensitive company announcements or qualitative material.
If you spot an error that warrants correction, please contact the editor at editorial-team@simplywallst.com. This article by Simply Wall St is general in nature. It does not constitute a recommendation to buy or sell any stock, and does not take account of your objectives, or your financial situation. Simply Wall St has no position in the stocks mentioned. Thank you for reading.
