
 Yahoo Finance
 What We Think Of Barnes Group Inc.’s (NYSE:B) Investment Potential

Want to participate in a short research study? Help shape the future of investing tools and you could win a $250 gift card!
Today we'll look at Barnes Group Inc. (NYSE:B) and reflect on its potential as an investment. In particular, we'll consider its Return On Capital Employed (ROCE), as that can give us insight into how profitably the company is able to employ capital in its business.
First, we'll go over how we calculate ROCE. Second, we'll look at its ROCE compared to similar companies. And finally, we'll look at how its current liabilities are impacting its ROCE.
Return On Capital Employed (ROCE): What is it?
ROCE is a metric for evaluating how much pre-tax income (in percentage terms) a company earns on the capital invested in its business. All else being equal, a better business will have a higher ROCE. In brief, it is a useful tool, but it is not without drawbacks. Author Edwin Whiting says to be careful when comparing the ROCE of different businesses, since 'No two businesses are exactly alike.'
How Do You Calculate Return On Capital Employed?
Analysts use this formula to calculate return on capital employed:
Return on Capital Employed = Earnings Before Interest and Tax (EBIT) ÷ (Total Assets - Current Liabilities)
Or for Barnes Group:
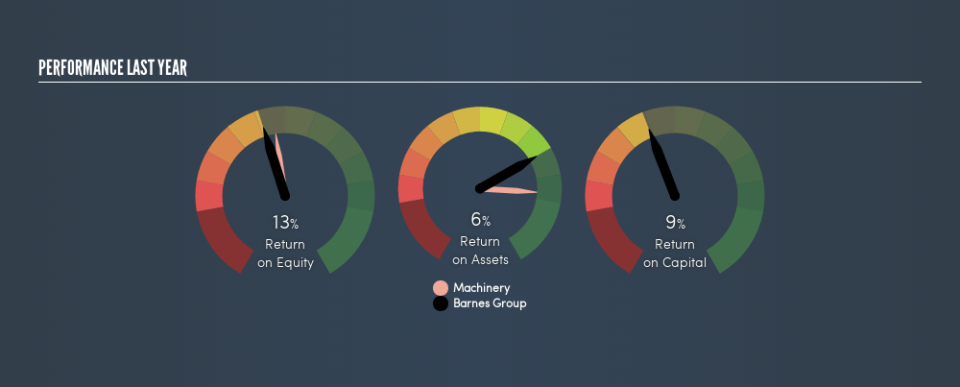
0.095 = US$230m ÷ (US$2.8b - US$369m) (Based on the trailing twelve months to March 2019.)
Therefore, Barnes Group has an ROCE of 9.5%.
View our latest analysis for Barnes Group
Does Barnes Group Have A Good ROCE?
ROCE is commonly used for comparing the performance of similar businesses. Using our data, Barnes Group's ROCE appears to be around the 11% average of the Machinery industry. Separate from how Barnes Group stacks up against its industry, its ROCE in absolute terms is mediocre; relative to the returns on government bonds. Investors may wish to consider higher-performing investments.
You can click on the image below to see (in greater detail) how Barnes Group's past growth compares to other companies.
Remember that this metric is backwards looking - it shows what has happened in the past, and does not accurately predict the future. ROCE can be misleading for companies in cyclical industries, with returns looking impressive during the boom times, but very weak during the busts. ROCE is, after all, simply a snap shot of a single year. Since the future is so important for investors, you should check out our free report on analyst forecasts for Barnes Group.
What Are Current Liabilities, And How Do They Affect Barnes Group's ROCE?
Current liabilities are short term bills and invoices that need to be paid in 12 months or less. The ROCE equation subtracts current liabilities from capital employed, so a company with a lot of current liabilities appears to have less capital employed, and a higher ROCE than otherwise. To check the impact of this, we calculate if a company has high current liabilities relative to its total assets.
Barnes Group has total assets of US$2.8b and current liabilities of US$369m. As a result, its current liabilities are equal to approximately 13% of its total assets. It is good to see a restrained amount of current liabilities, as this limits the effect on ROCE.
The Bottom Line On Barnes Group's ROCE
With that in mind, we're not overly impressed with Barnes Group's ROCE, so it may not be the most appealing prospect. But note: make sure you look for a great company, not just the first idea you come across. So take a peek at this free list of interesting companies with strong recent earnings growth (and a P/E ratio below 20).
For those who like to find winning investments this free list of growing companies with recent insider purchasing, could be just the ticket.
We aim to bring you long-term focused research analysis driven by fundamental data. Note that our analysis may not factor in the latest price-sensitive company announcements or qualitative material.
If you spot an error that warrants correction, please contact the editor at editorial-team@simplywallst.com. This article by Simply Wall St is general in nature. It does not constitute a recommendation to buy or sell any stock, and does not take account of your objectives, or your financial situation. Simply Wall St has no position in the stocks mentioned. Thank you for reading.
