
 Yahoo Finance
 There's Been No Shortage Of Growth Recently For SKY Network Television's (NZSE:SKT) Returns On Capital
Finding a business that has the potential to grow substantially is not easy, but it is possible if we look at a few key financial metrics. Firstly, we'll want to see a proven return on capital employed (ROCE) that is increasing, and secondly, an expanding base of capital employed. Ultimately, this demonstrates that it's a business that is reinvesting profits at increasing rates of return. With that in mind, we've noticed some promising trends at SKY Network Television (NZSE:SKT) so let's look a bit deeper.
What Is Return On Capital Employed (ROCE)?
For those that aren't sure what ROCE is, it measures the amount of pre-tax profits a company can generate from the capital employed in its business. The formula for this calculation on SKY Network Television is:
Return on Capital Employed = Earnings Before Interest and Tax (EBIT) ÷ (Total Assets - Current Liabilities)
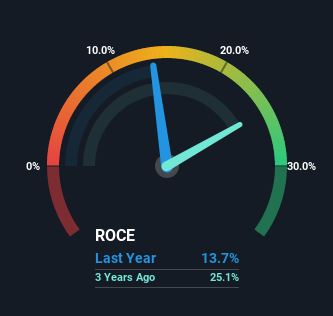
0.14 = NZ$73m ÷ (NZ$777m - NZ$242m) (Based on the trailing twelve months to June 2022).
Therefore, SKY Network Television has an ROCE of 14%. In absolute terms, that's a pretty normal return, and it's somewhat close to the Media industry average of 12%.
See our latest analysis for SKY Network Television
Above you can see how the current ROCE for SKY Network Television compares to its prior returns on capital, but there's only so much you can tell from the past. If you're interested, you can view the analysts predictions in our free report on analyst forecasts for the company.
So How Is SKY Network Television's ROCE Trending?
We're pretty happy with how the ROCE has been trending at SKY Network Television. The figures show that over the last five years, returns on capital have grown by 22%. The company is now earning NZ$0.1 per dollar of capital employed. In regards to capital employed, SKY Network Television appears to been achieving more with less, since the business is using 68% less capital to run its operation. A business that's shrinking its asset base like this isn't usually typical of a soon to be multi-bagger company.
For the record though, there was a noticeable increase in the company's current liabilities over the period, so we would attribute some of the ROCE growth to that. Essentially the business now has suppliers or short-term creditors funding about 31% of its operations, which isn't ideal. Keep an eye out for future increases because when the ratio of current liabilities to total assets gets particularly high, this can introduce some new risks for the business.
What We Can Learn From SKY Network Television's ROCE
In the end, SKY Network Television has proven it's capital allocation skills are good with those higher returns from less amount of capital. And since the stock has dived 80% over the last five years, there may be other factors affecting the company's prospects. Still, it's worth doing some further research to see if the trends will continue into the future.
If you'd like to know more about SKY Network Television, we've spotted 3 warning signs, and 1 of them doesn't sit too well with us.
If you want to search for solid companies with great earnings, check out this free list of companies with good balance sheets and impressive returns on equity.
Have feedback on this article? Concerned about the content? Get in touch with us directly. Alternatively, email editorial-team (at) simplywallst.com.
This article by Simply Wall St is general in nature. We provide commentary based on historical data and analyst forecasts only using an unbiased methodology and our articles are not intended to be financial advice. It does not constitute a recommendation to buy or sell any stock, and does not take account of your objectives, or your financial situation. We aim to bring you long-term focused analysis driven by fundamental data. Note that our analysis may not factor in the latest price-sensitive company announcements or qualitative material. Simply Wall St has no position in any stocks mentioned.
Join A Paid User Research Session
You’ll receive a US$30 Amazon Gift card for 1 hour of your time while helping us build better investing tools for the individual investors like yourself. Sign up here
