
 Yahoo Finance
 There's Been No Shortage Of Growth Recently For SiTime's (NASDAQ:SITM) Returns On Capital
What trends should we look for it we want to identify stocks that can multiply in value over the long term? Amongst other things, we'll want to see two things; firstly, a growing return on capital employed (ROCE) and secondly, an expansion in the company's amount of capital employed. This shows us that it's a compounding machine, able to continually reinvest its earnings back into the business and generate higher returns. So on that note, SiTime (NASDAQ:SITM) looks quite promising in regards to its trends of return on capital.
Return On Capital Employed (ROCE): What Is It?
If you haven't worked with ROCE before, it measures the 'return' (pre-tax profit) a company generates from capital employed in its business. To calculate this metric for SiTime, this is the formula:
Return on Capital Employed = Earnings Before Interest and Tax (EBIT) ÷ (Total Assets - Current Liabilities)
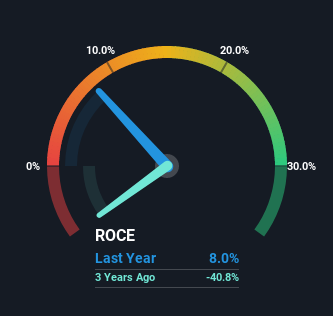
0.08 = US$55m ÷ (US$734m - US$44m) (Based on the trailing twelve months to June 2022).
Thus, SiTime has an ROCE of 8.0%. Ultimately, that's a low return and it under-performs the Semiconductor industry average of 15%.
Check out our latest analysis for SiTime
In the above chart we have measured SiTime's prior ROCE against its prior performance, but the future is arguably more important. If you'd like to see what analysts are forecasting going forward, you should check out our free report for SiTime.
What Can We Tell From SiTime's ROCE Trend?
The fact that SiTime is now generating some pre-tax profits from its prior investments is very encouraging. About four years ago the company was generating losses but things have turned around because it's now earning 8.0% on its capital. In addition to that, SiTime is employing 3,922% more capital than previously which is expected of a company that's trying to break into profitability. This can tell us that the company has plenty of reinvestment opportunities that are able to generate higher returns.
One more thing to note, SiTime has decreased current liabilities to 5.9% of total assets over this period, which effectively reduces the amount of funding from suppliers or short-term creditors. Therefore we can rest assured that the growth in ROCE is a result of the business' fundamental improvements, rather than a cooking class featuring this company's books.
The Key Takeaway
In summary, it's great to see that SiTime has managed to break into profitability and is continuing to reinvest in its business. And since the stock has fallen 56% over the last year, there might be an opportunity here. So researching this company further and determining whether or not these trends will continue seems justified.
On a separate note, we've found 3 warning signs for SiTime you'll probably want to know about.
While SiTime isn't earning the highest return, check out this free list of companies that are earning high returns on equity with solid balance sheets.
Have feedback on this article? Concerned about the content? Get in touch with us directly. Alternatively, email editorial-team (at) simplywallst.com.
This article by Simply Wall St is general in nature. We provide commentary based on historical data and analyst forecasts only using an unbiased methodology and our articles are not intended to be financial advice. It does not constitute a recommendation to buy or sell any stock, and does not take account of your objectives, or your financial situation. We aim to bring you long-term focused analysis driven by fundamental data. Note that our analysis may not factor in the latest price-sensitive company announcements or qualitative material. Simply Wall St has no position in any stocks mentioned.
Join A Paid User Research Session
You’ll receive a US$30 Amazon Gift card for 1 hour of your time while helping us build better investing tools for the individual investors like yourself. Sign up here
