
 Yahoo Finance
 There's Been No Shortage Of Growth Recently For Brightcove's (NASDAQ:BCOV) Returns On Capital
What are the early trends we should look for to identify a stock that could multiply in value over the long term? Ideally, a business will show two trends; firstly a growing return on capital employed (ROCE) and secondly, an increasing amount of capital employed. Basically this means that a company has profitable initiatives that it can continue to reinvest in, which is a trait of a compounding machine. So on that note, Brightcove (NASDAQ:BCOV) looks quite promising in regards to its trends of return on capital.
What is Return On Capital Employed (ROCE)?
Just to clarify if you're unsure, ROCE is a metric for evaluating how much pre-tax income (in percentage terms) a company earns on the capital invested in its business. The formula for this calculation on Brightcove is:
Return on Capital Employed = Earnings Before Interest and Tax (EBIT) ÷ (Total Assets - Current Liabilities)
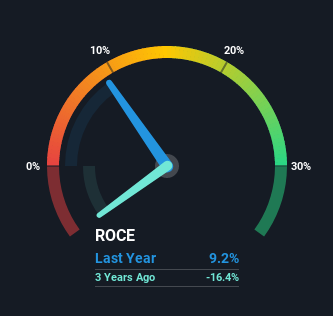
0.092 = US$9.0m ÷ (US$194m - US$96m) (Based on the trailing twelve months to September 2021).
Therefore, Brightcove has an ROCE of 9.2%. In absolute terms, that's a low return and it also under-performs the IT industry average of 12%.
See our latest analysis for Brightcove
In the above chart we have measured Brightcove's prior ROCE against its prior performance, but the future is arguably more important. If you're interested, you can view the analysts predictions in our free report on analyst forecasts for the company.
What Can We Tell From Brightcove's ROCE Trend?
Brightcove has broken into the black (profitability) and we're sure it's a sight for sore eyes. The company now earns 9.2% on its capital, because five years ago it was incurring losses. On top of that, what's interesting is that the amount of capital being employed has remained steady, so the business hasn't needed to put any additional money to work to generate these higher returns. That being said, while an increase in efficiency is no doubt appealing, it'd be helpful to know if the company does have any investment plans going forward. After all, a company can only become a long term multi-bagger if it continually reinvests in itself at high rates of return.
For the record though, there was a noticeable increase in the company's current liabilities over the period, so we would attribute some of the ROCE growth to that. Effectively this means that suppliers or short-term creditors are now funding 50% of the business, which is more than it was five years ago. And with current liabilities at those levels, that's pretty high.
The Bottom Line
To sum it up, Brightcove is collecting higher returns from the same amount of capital, and that's impressive. Investors may not be impressed by the favorable underlying trends yet because over the last five years the stock has only returned 15% to shareholders. So with that in mind, we think the stock deserves further research.
Brightcove does have some risks though, and we've spotted 2 warning signs for Brightcove that you might be interested in.
While Brightcove may not currently earn the highest returns, we've compiled a list of companies that currently earn more than 25% return on equity. Check out this free list here.
This article by Simply Wall St is general in nature. We provide commentary based on historical data and analyst forecasts only using an unbiased methodology and our articles are not intended to be financial advice. It does not constitute a recommendation to buy or sell any stock, and does not take account of your objectives, or your financial situation. We aim to bring you long-term focused analysis driven by fundamental data. Note that our analysis may not factor in the latest price-sensitive company announcements or qualitative material. Simply Wall St has no position in any stocks mentioned.
Have feedback on this article? Concerned about the content? Get in touch with us directly. Alternatively, email editorial-team (at) simplywallst.com.
