
 Yahoo Finance
 There's Been No Shortage Of Growth Recently For New Zealand King Salmon Investments' (NZSE:NZK) Returns On Capital
Did you know there are some financial metrics that can provide clues of a potential multi-bagger? In a perfect world, we'd like to see a company investing more capital into its business and ideally the returns earned from that capital are also increasing. This shows us that it's a compounding machine, able to continually reinvest its earnings back into the business and generate higher returns. With that in mind, we've noticed some promising trends at New Zealand King Salmon Investments (NZSE:NZK) so let's look a bit deeper.
Understanding Return On Capital Employed (ROCE)
If you haven't worked with ROCE before, it measures the 'return' (pre-tax profit) a company generates from capital employed in its business. To calculate this metric for New Zealand King Salmon Investments, this is the formula:
Return on Capital Employed = Earnings Before Interest and Tax (EBIT) ÷ (Total Assets - Current Liabilities)
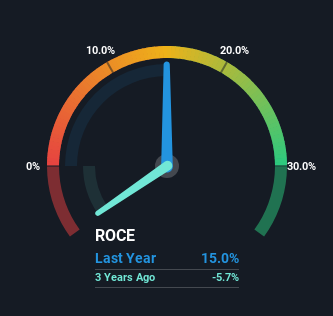
0.15 = NZ$31m ÷ (NZ$239m - NZ$30m) (Based on the trailing twelve months to January 2024).
So, New Zealand King Salmon Investments has an ROCE of 15%. On its own, that's a standard return, however it's much better than the 11% generated by the Food industry.
Check out our latest analysis for New Zealand King Salmon Investments
Above you can see how the current ROCE for New Zealand King Salmon Investments compares to its prior returns on capital, but there's only so much you can tell from the past. If you're interested, you can view the analysts predictions in our free analyst report for New Zealand King Salmon Investments .
So How Is New Zealand King Salmon Investments' ROCE Trending?
New Zealand King Salmon Investments has not disappointed with their ROCE growth. The figures show that over the last five years, ROCE has grown 42% whilst employing roughly the same amount of capital. So it's likely that the business is now reaping the full benefits of its past investments, since the capital employed hasn't changed considerably. On that front, things are looking good so it's worth exploring what management has said about growth plans going forward.
The Bottom Line
As discussed above, New Zealand King Salmon Investments appears to be getting more proficient at generating returns since capital employed has remained flat but earnings (before interest and tax) are up. And since the stock has dived 82% over the last five years, there may be other factors affecting the company's prospects. In any case, we believe the economic trends of this company are positive and looking into the stock further could prove rewarding.
New Zealand King Salmon Investments does come with some risks though, we found 3 warning signs in our investment analysis, and 1 of those doesn't sit too well with us...
While New Zealand King Salmon Investments isn't earning the highest return, check out this free list of companies that are earning high returns on equity with solid balance sheets.
Have feedback on this article? Concerned about the content? Get in touch with us directly. Alternatively, email editorial-team (at) simplywallst.com.
This article by Simply Wall St is general in nature. We provide commentary based on historical data and analyst forecasts only using an unbiased methodology and our articles are not intended to be financial advice. It does not constitute a recommendation to buy or sell any stock, and does not take account of your objectives, or your financial situation. We aim to bring you long-term focused analysis driven by fundamental data. Note that our analysis may not factor in the latest price-sensitive company announcements or qualitative material. Simply Wall St has no position in any stocks mentioned.
