
 Yahoo Finance
 There's Been No Shortage Of Growth Recently For Boart Longyear Group's (ASX:BLY) Returns On Capital
What are the early trends we should look for to identify a stock that could multiply in value over the long term? In a perfect world, we'd like to see a company investing more capital into its business and ideally the returns earned from that capital are also increasing. Put simply, these types of businesses are compounding machines, meaning they are continually reinvesting their earnings at ever-higher rates of return. With that in mind, we've noticed some promising trends at Boart Longyear Group (ASX:BLY) so let's look a bit deeper.
What is Return On Capital Employed (ROCE)?
If you haven't worked with ROCE before, it measures the 'return' (pre-tax profit) a company generates from capital employed in its business. Analysts use this formula to calculate it for Boart Longyear Group:
Return on Capital Employed = Earnings Before Interest and Tax (EBIT) ÷ (Total Assets - Current Liabilities)
0.13 = US$70m ÷ (US$709m - US$172m) (Based on the trailing twelve months to December 2021).
So, Boart Longyear Group has an ROCE of 13%. On its own, that's a standard return, however it's much better than the 8.7% generated by the Metals and Mining industry.
Check out our latest analysis for Boart Longyear Group
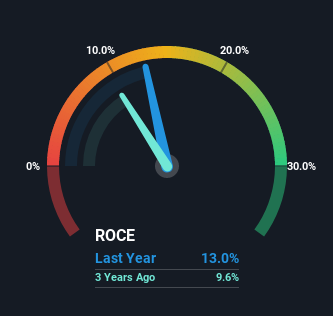
Historical performance is a great place to start when researching a stock so above you can see the gauge for Boart Longyear Group's ROCE against it's prior returns. If you want to delve into the historical earnings, revenue and cash flow of Boart Longyear Group, check out these free graphs here.
So How Is Boart Longyear Group's ROCE Trending?
We're delighted to see that Boart Longyear Group is reaping rewards from its investments and is now generating some pre-tax profits. About five years ago the company was generating losses but things have turned around because it's now earning 13% on its capital. In addition to that, Boart Longyear Group is employing 21% more capital than previously which is expected of a company that's trying to break into profitability. This can tell us that the company has plenty of reinvestment opportunities that are able to generate higher returns.
On a related note, the company's ratio of current liabilities to total assets has decreased to 24%, which basically reduces it's funding from the likes of short-term creditors or suppliers. Therefore we can rest assured that the growth in ROCE is a result of the business' fundamental improvements, rather than a cooking class featuring this company's books.
What We Can Learn From Boart Longyear Group's ROCE
In summary, it's great to see that Boart Longyear Group has managed to break into profitability and is continuing to reinvest in its business. Although the company may be facing some issues elsewhere since the stock has plunged 99% in the last five years. In any case, we believe the economic trends of this company are positive and looking into the stock further could prove rewarding.
One more thing to note, we've identified 2 warning signs with Boart Longyear Group and understanding these should be part of your investment process.
For those who like to invest in solid companies, check out this free list of companies with solid balance sheets and high returns on equity.
Have feedback on this article? Concerned about the content? Get in touch with us directly. Alternatively, email editorial-team (at) simplywallst.com.
This article by Simply Wall St is general in nature. We provide commentary based on historical data and analyst forecasts only using an unbiased methodology and our articles are not intended to be financial advice. It does not constitute a recommendation to buy or sell any stock, and does not take account of your objectives, or your financial situation. We aim to bring you long-term focused analysis driven by fundamental data. Note that our analysis may not factor in the latest price-sensitive company announcements or qualitative material. Simply Wall St has no position in any stocks mentioned.
