
 Yahoo Finance
 What Is Texas Roadhouse's (NASDAQ:TXRH) P/E Ratio After Its Share Price Tanked?

Unfortunately for some shareholders, the Texas Roadhouse (NASDAQ:TXRH) share price has dived 34% in the last thirty days. The recent drop has obliterated the annual return, with the share price now down 29% over that longer period.
Assuming nothing else has changed, a lower share price makes a stock more attractive to potential buyers. While the market sentiment towards a stock is very changeable, in the long run, the share price will tend to move in the same direction as earnings per share. The implication here is that long term investors have an opportunity when expectations of a company are too low. Perhaps the simplest way to get a read on investors' expectations of a business is to look at its Price to Earnings Ratio (PE Ratio). A high P/E implies that investors have high expectations of what a company can achieve compared to a company with a low P/E ratio.
View our latest analysis for Texas Roadhouse
How Does Texas Roadhouse's P/E Ratio Compare To Its Peers?
Texas Roadhouse's P/E of 16.98 indicates some degree of optimism towards the stock. You can see in the image below that the average P/E (15.6) for companies in the hospitality industry is lower than Texas Roadhouse's P/E.
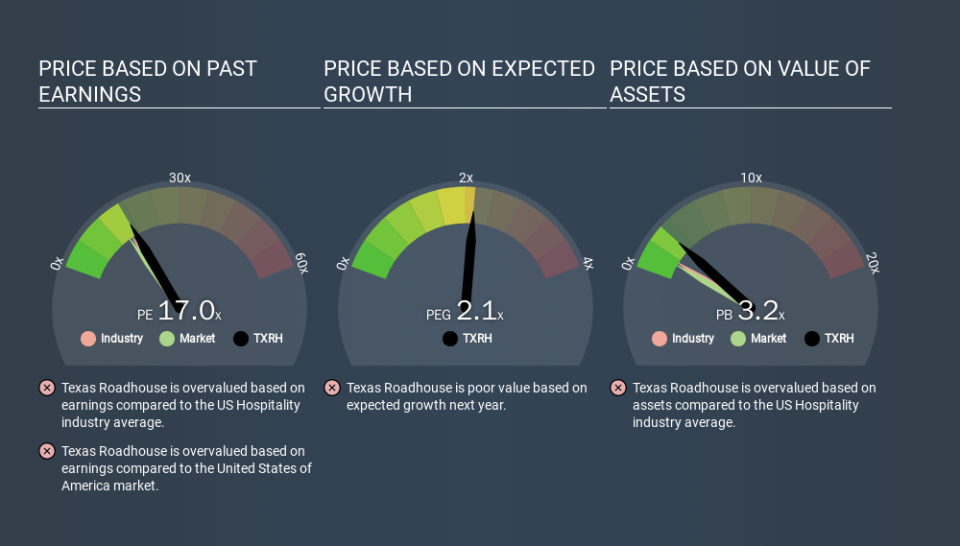
Texas Roadhouse's P/E tells us that market participants think the company will perform better than its industry peers, going forward. Shareholders are clearly optimistic, but the future is always uncertain. So investors should delve deeper. I like to check if company insiders have been buying or selling.
How Growth Rates Impact P/E Ratios
P/E ratios primarily reflect market expectations around earnings growth rates. When earnings grow, the 'E' increases, over time. And in that case, the P/E ratio itself will drop rather quickly. Then, a lower P/E should attract more buyers, pushing the share price up.
Most would be impressed by Texas Roadhouse earnings growth of 12% in the last year. And earnings per share have improved by 15% annually, over the last five years. This could arguably justify a relatively high P/E ratio.
Remember: P/E Ratios Don't Consider The Balance Sheet
Don't forget that the P/E ratio considers market capitalization. That means it doesn't take debt or cash into account. In theory, a company can lower its future P/E ratio by using cash or debt to invest in growth.
Spending on growth might be good or bad a few years later, but the point is that the P/E ratio does not account for the option (or lack thereof).
So What Does Texas Roadhouse's Balance Sheet Tell Us?
Texas Roadhouse has net cash of US$108m. That should lead to a higher P/E than if it did have debt, because its strong balance sheets gives it more options.
The Verdict On Texas Roadhouse's P/E Ratio
Texas Roadhouse's P/E is 17.0 which is above average (14.7) in its market. Its strong balance sheet gives the company plenty of resources for extra growth, and it has already proven it can grow. So it does not seem strange that the P/E is above average. Given Texas Roadhouse's P/E ratio has declined from 25.9 to 17.0 in the last month, we know for sure that the market is significantly less confident about the business today, than it was back then. For those who prefer to invest with the flow of momentum, that might be a bad sign, but for a contrarian, it may signal opportunity.
Investors should be looking to buy stocks that the market is wrong about. If the reality for a company is better than it expects, you can make money by buying and holding for the long term. So this free visualization of the analyst consensus on future earnings could help you make the right decision about whether to buy, sell, or hold.
But note: Texas Roadhouse may not be the best stock to buy. So take a peek at this free list of interesting companies with strong recent earnings growth (and a P/E ratio below 20).
If you spot an error that warrants correction, please contact the editor at editorial-team@simplywallst.com. This article by Simply Wall St is general in nature. It does not constitute a recommendation to buy or sell any stock, and does not take account of your objectives, or your financial situation. Simply Wall St has no position in the stocks mentioned.
We aim to bring you long-term focused research analysis driven by fundamental data. Note that our analysis may not factor in the latest price-sensitive company announcements or qualitative material. Thank you for reading.
