
 Yahoo Finance
 Tetra Tech (TTEK) Q3 Earnings & Revenues Beat, '23 View Up

Tetra Tech, Inc. TTEK reported impressive third-quarter fiscal 2023 (ended Jul 2, 2023) results. The company’s earnings beat the Zacks Consensus Estimate by 9.3%, marking the 24th consecutive quarter of delivering a surprise. Sales also surpassed estimates by 1.5%.
Tetra Tech’s adjusted earnings per share in the reported fiscal quarter were $1.29, beating the consensus estimate of adjusted earnings per share of $1.18. Quarterly earnings expanded 19.4% from the year-ago reported figure of 1.08 cents per share.
The bottom line also surpassed management’s projection of earnings of $1.15-$1.20 per share.
Revenue & Segmental Performance
In the fiscal third quarter, Tetra Tech generated adjusted revenues of $1,208.9 million, reflecting a year-over-year increase of 35.8%. Adjusted net revenues (adjusted revenues minus subcontractor costs) were $987.6 million, up 37.1% year over year. The quarterly top line came above management’s guidance of $750-$800 million.
Tetra Tech’s revenues exceeded the Zacks Consensus Estimate of $973 million.
The backlog at the end of the fiscal quarter was $4,386.3 million, up 25% year over year.
Revenues from U.S. Federal customers (accounting for 25% of the quarter’s revenues) were up 30% year over year, supported by broad-based environmental growth. U.S. Commercial sales (20% of the quarter’s revenues) increased 22% year over year on higher clean Energy and Environmental sales.
U.S. State and Local sales (12% of the quarter’s revenues) increased 16%, due to strength in digital water. International sales (43% of the quarter’s revenues) increased 68% year over year, backed by higher sustainable Infrastructure sales.
Tetra Tech reports revenues under the segments discussed below:
Net sales of the Government Services Group segment were $390 million, up 16% year over year. Revenues from the Commercial/International Services Group segment totaled $597 million, representing a year-over-year increase of 55%.
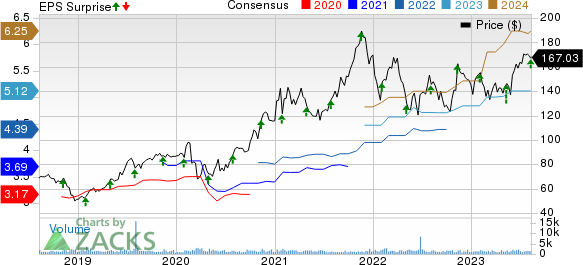
Tetra Tech, Inc. Price, Consensus and EPS Surprise
Tetra Tech, Inc. price-consensus-eps-surprise-chart | Tetra Tech, Inc. Quote
Margin Profile
In the fiscal third quarter, Tetra Tech’s subcontractor costs totaled $221.4 million, reflecting an increase of 30.4% from the year-ago quarter. Other costs of revenues (adjusted) were $798.7 million, up 38.7% from the fiscal third quarter 2022. Selling, general and administrative expenses were $89.1 million, up 46.2% from the year-ago fiscal quarter.
Operating income (adjusted) in the reported fiscal quarter increased 20.4% year over year to $99.8 million, while the adjusted margin increased 60 basis points to 12.1%.
Balance Sheet and Cash Flow
While exiting third-quarter fiscal 2023, Tetra Tech had cash and cash equivalents of $176.1 million, compared with $185.1 million recorded at the end of the fourth quarter of fiscal 2022. Long-term debt was $906.9 million, compared with $246.2 million recorded at the end of fourth-quarter fiscal 2022.
In the first nine months of fiscal 2023, Tetra Tech generated net cash of $246.1 million from operating activities, compared with $276 million in the prior fiscal year’s comparable period. Capital expenditure was $17.3 million, up 106.2% year over year. In the said fiscal period, TTEK’s proceeds from borrowings amounted to $979.9 million, while repayments on long-term debt totaled $411.7 million.
Shareholder-Friendly Policies
Tetra Tech distributed dividends totaling $38.3 million in the first nine months of fiscal 2023. This compares favorably with the dividends of $33.9 million distributed in the year-ago fiscal period.
FY23 Outlook Raised
For fiscal 2023 (ending September 2023), Tetra Tech anticipates net revenues of $3.66-$3.71 billion, compared with $3.10 - $3.20 billion anticipated earlier. The midpoint of the guided range — $3.69 billion — lies above the Zacks Consensus Estimate of $3.66 billion. Adjusted earnings are predicted to be $5.23-$5.28 per share, compared with $5.07-$5.17 per share predicted earlier. The consensus estimate for the same is $5.12 per share.
For the fourth quarter of fiscal 2023, management estimates net revenues of $965-$1,015 million. The midpoint of the guided range — $990 million — lies above the Zacks Consensus Estimate of $976.7 million. Adjusted earnings are projected to be $1.43-$1.48 per share for the fiscal quarter. The midpoint of the guided range — $1.46 — lies above the consensus estimate of adjusted earnings of $1.44 per share.
Zacks Rank & Stocks to Consider
TTEK currently carries a Zacks Rank #3 (Hold). Some better-ranked companies from the Industrial Products sector are discussed below:
Caterpillar Inc. CAT presently sports a Zacks Rank #1 (Strong Buy). You can see the complete list of today’s Zacks #1 Rank stocks.
CAT’s earnings surprise in the last four quarters was 18.5%, on average. In the past 60 days, estimates for Caterpillar’s earnings have increased 7.3% for 2023. The stock has gained 46.7% in the past year.
A. O. Smith Corp. AOS currently carries a Zacks Rank #2 (Buy). AOS’ earnings surprise in the last four quarters was 10.5%, on average.
In the past 60 days, estimates for A. O. Smith’s earnings have increased 2.6% for 2023. The stock has gained 16.6% in the past year.
Alamo Group Inc. ALG presently carries a Zacks Rank of 2. ALG’s earnings surprise in the last four quarters was 13%, on average.
In the past 60 days, estimates for Alamo’s 2023 earnings have increased 1.1%. The stock has gained 29.6% in the past year.
Want the latest recommendations from Zacks Investment Research? Today, you can download 7 Best Stocks for the Next 30 Days. Click to get this free report
Caterpillar Inc. (CAT) : Free Stock Analysis Report
Tetra Tech, Inc. (TTEK) : Free Stock Analysis Report
A. O. Smith Corporation (AOS) : Free Stock Analysis Report
Alamo Group, Inc. (ALG) : Free Stock Analysis Report
