
 Yahoo Finance
 Should You Be Tempted To Sell Reef Casino Trust (ASX:RCT) At Its Current PE Ratio?

This analysis is intended to introduce important early concepts to people who are starting to invest and want to start learning about core concepts of fundamental analysis on practical examples from today’s market.
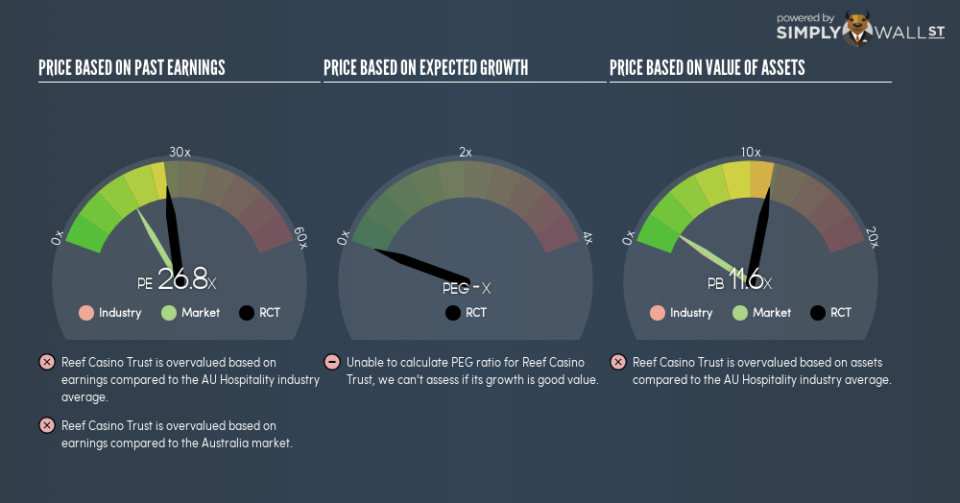
Reef Casino Trust (ASX:RCT) is currently trading at a trailing P/E of 26.8, which is close to the industry average of 26.8. Although some investors may see this as unappealing, it is important to understand the assumptions behind the P/E ratio before making judgments. In this article, I will deconstruct the P/E ratio and highlight what you need to be careful of when using the P/E ratio.
View our latest analysis for Reef Casino Trust
What you need to know about the P/E ratio
P/E is a popular ratio used for relative valuation. By comparing a stock’s price per share to its earnings per share, we are able to see how much investors are paying for each dollar of the company’s earnings.
P/E Calculation for RCT
Price-Earnings Ratio = Price per share ÷ Earnings per share
RCT Price-Earnings Ratio = A$3.04 ÷ A$0.113 = 26.8x
The P/E ratio itself doesn’t tell you a lot; however, it becomes very insightful when you compare it with other similar companies. We preferably want to compare the stock’s P/E ratio to the average of companies that have similar features to RCT, such as capital structure and profitability. A common peer group is companies that exist in the same industry, which is what I use. Reef Casino Trust (ASX:RCT) trades on a trailing P/E of 26.8. This isn’t too far from the industry average (which is 26.8). This multiple is a median of profitable companies of 18 Hospitality companies in AU including Transmetro, Eumundi Group and Ainsworth Game Technology. You can think of it like this: the market is suggesting that RCT has similar prospects to its peers in the same industry.
Assumptions to be aware of
However, you should be aware that this analysis makes certain assumptions. Firstly, that our peer group contains companies that are similar to RCT. If this isn’t the case, the difference in P/E could be due to other factors. Take, for example, the scenario where Reef Casino Trust is growing profits more quickly than the average comparable company. In that case, the market may be correct to value it on a higher P/E ratio. Of course, it is possible that the stocks we are comparing with RCT are not fairly valued. So while we can reasonably surmise that it is optimistically valued relative to a peer group, it might be fairly valued, if the peer group is undervalued.
What this means for you:
Since you may have already conducted your due diligence on RCT, the undervaluation of the stock may mean it is a good time to top up on your current holdings. But at the end of the day, keep in mind that relative valuation relies heavily on critical assumptions I’ve outlined above. Remember that basing your investment decision off one metric alone is certainly not sufficient. There are many things I have not taken into account in this article and the PE ratio is very one-dimensional. If you have not done so already, I highly recommend you to complete your research by taking a look at the following:
Financial Health: Are RCT’s operations financially sustainable? Balance sheets can be hard to analyze, which is why we’ve done it for you. Check out our financial health checks here.
Past Track Record: Has RCT been consistently performing well irrespective of the ups and downs in the market? Go into more detail in the past performance analysis and take a look at the free visual representations of RCT’s historicals for more clarity.
Other High-Performing Stocks: Are there other stocks that provide better prospects with proven track records? Explore our free list of these great stocks here.
To help readers see past the short term volatility of the financial market, we aim to bring you a long-term focused research analysis purely driven by fundamental data. Note that our analysis does not factor in the latest price-sensitive company announcements.
The author is an independent contributor and at the time of publication had no position in the stocks mentioned. For errors that warrant correction please contact the editor at editorial-team@simplywallst.com.
