
 Yahoo Finance
 Should You Be Tempted To Sell Mount Gibson Iron Limited (ASX:MGX) Because Of Its P/E Ratio?

Want to participate in a short research study? Help shape the future of investing tools and you could win a $250 gift card!
This article is for investors who would like to improve their understanding of price to earnings ratios (P/E ratios). We'll show how you can use Mount Gibson Iron Limited's (ASX:MGX) P/E ratio to inform your assessment of the investment opportunity. Looking at earnings over the last twelve months, Mount Gibson Iron has a P/E ratio of 16.79. That is equivalent to an earnings yield of about 6.0%.
Check out our latest analysis for Mount Gibson Iron
How Do You Calculate A P/E Ratio?
The formula for price to earnings is:
Price to Earnings Ratio = Price per Share ÷ Earnings per Share (EPS)
Or for Mount Gibson Iron:
P/E of 16.79 = A$0.98 ÷ A$0.058 (Based on the year to December 2018.)
Is A High Price-to-Earnings Ratio Good?
A higher P/E ratio means that buyers have to pay a higher price for each A$1 the company has earned over the last year. That isn't necessarily good or bad, but a high P/E implies relatively high expectations of what a company can achieve in the future.
How Growth Rates Impact P/E Ratios
P/E ratios primarily reflect market expectations around earnings growth rates. When earnings grow, the 'E' increases, over time. That means even if the current P/E is high, it will reduce over time if the share price stays flat. Then, a lower P/E should attract more buyers, pushing the share price up.
Mount Gibson Iron saw earnings per share decrease by 25% last year. And EPS is down 20% a year, over the last 5 years. This might lead to muted expectations.
How Does Mount Gibson Iron's P/E Ratio Compare To Its Peers?
One good way to get a quick read on what market participants expect of a company is to look at its P/E ratio. The image below shows that Mount Gibson Iron has a higher P/E than the average (12) P/E for companies in the metals and mining industry.
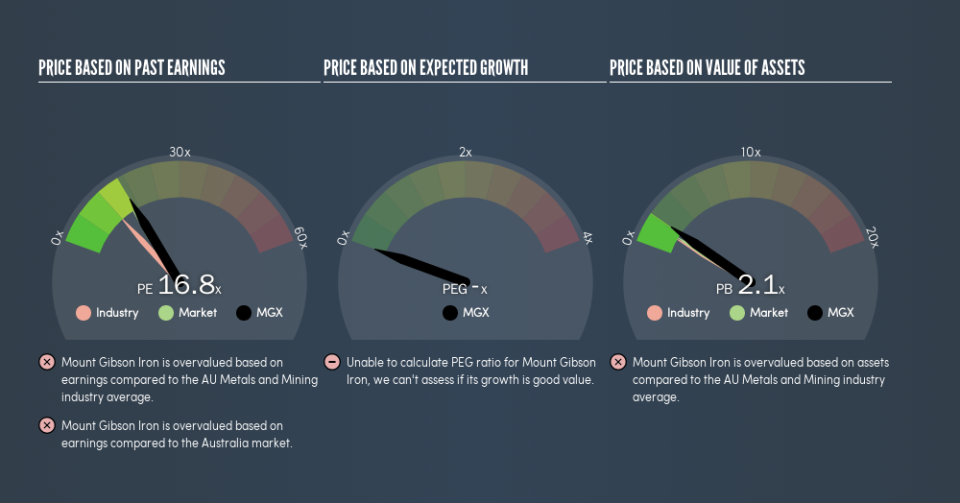
Its relatively high P/E ratio indicates that Mount Gibson Iron shareholders think it will perform better than other companies in its industry classification. Shareholders are clearly optimistic, but the future is always uncertain. So investors should delve deeper. I like to check if company insiders have been buying or selling.
Remember: P/E Ratios Don't Consider The Balance Sheet
It's important to note that the P/E ratio considers the market capitalization, not the enterprise value. So it won't reflect the advantage of cash, or disadvantage of debt. Hypothetically, a company could reduce its future P/E ratio by spending its cash (or taking on debt) to achieve higher earnings.
Such spending might be good or bad, overall, but the key point here is that you need to look at debt to understand the P/E ratio in context.
How Does Mount Gibson Iron's Debt Impact Its P/E Ratio?
Mount Gibson Iron has net cash of AU$431m. This is fairly high at 37% of its market capitalization. That might mean balance sheet strength is important to the business, but should also help push the P/E a bit higher than it would otherwise be.
The Verdict On Mount Gibson Iron's P/E Ratio
Mount Gibson Iron's P/E is 16.8 which is about average (15.9) in the AU market. While the lack of recent growth is probably muting optimism, the net cash position means it's not surprising that expectations put the company roughly in line with the market average P/E.
When the market is wrong about a stock, it gives savvy investors an opportunity. As value investor Benjamin Graham famously said, 'In the short run, the market is a voting machine but in the long run, it is a weighing machine.' So this free visualization of the analyst consensus on future earnings could help you make the right decision about whether to buy, sell, or hold.
You might be able to find a better buy than Mount Gibson Iron. If you want a selection of possible winners, check out this free list of interesting companies that trade on a P/E below 20 (but have proven they can grow earnings).
We aim to bring you long-term focused research analysis driven by fundamental data. Note that our analysis may not factor in the latest price-sensitive company announcements or qualitative material.
If you spot an error that warrants correction, please contact the editor at editorial-team@simplywallst.com. This article by Simply Wall St is general in nature. It does not constitute a recommendation to buy or sell any stock, and does not take account of your objectives, or your financial situation. Simply Wall St has no position in the stocks mentioned. Thank you for reading.
